
Our second foundational topic is Mad Science. This is our nickname for when we do things to a mathematical expression.
What is a mathematical expression?
Here are some examples:
47
20 − (2 × 5)
2x + 5
24 ÷ 8 + 102 − 10 × 1⁄5
So a mathematical expression is one or more values (numbers or variables) that are linked with valid arithmetic operations.
We should notice three important things.

First, after we plug in any variables we can find the value of the entire expression. When we work the arithmetic correctly it will simplify into a single number.
Second, there are no equal signs in a mathematical expression. But the tools used to simplify an expression can be used to find y = something. This big topic will treat the expression 50 − (2 × 10) and the formula y = 50 − (2 × 10) as if there was no difference between them. Philopsophically they are distinct. But mathematically they are identical twins wearing slightly different clothes.
Third, invalid arithmetic operations do exist. You probably know at least one: the rule "never divide by zero". So an expression is like a recipe to follow, but we should not be asked to follow a gibberish recipe.
To summarize, we will explore more deeply how to use "mad science" to smoosh values together into a single, simple number. We use arithmetic: adding, subtracting, multiplying, dividing, and exponents. We will also study grouping structures and how they organize and order our arithmetic: parenthesis, fraction bars, square roots, and algorithms.
As we study this topic, work on making helpful and organized notes, so you have handy the comments, formulas, and example problems you need.
There are two ways to think about division. Unfortunately, most people are only taught one way and this causes people to get stuck.
The first way to think about division is dealing out cards.
I can model 6 ÷ 3 = 2 by acting out having six cards and dealing them out to three people until I am done.
How does it work?
Division: Dealing Out Cards (Works Great!)
We can nicely model 6 ÷ 3 = 2 by dealing out cards.
6 becomes the number of cards total.
3 becomes the number of piles.
2 becomes the number of cards per pile.
So the question is: How many cards end up in each pile?
Unfortunately, this way of thinking does not help with dividing by fractions.
Division: Dealing Out Cards (Does Not Work)
We cannot model 6 ÷ 1⁄2 = 12 by dealing out cards.
6 becomes the number of cards total.
½ becomes the number of piles. Now we get stuck! How do we deal cards to half a pile? What is "half a pile" anyway?
The question no longer makes sense. I cannot ask: How many cards end up in each pile?
The second way to think about division is making piles of a fixed size.
I can model 6 ÷ 3 = 2 by acting out having six cards and making piles of size three until I am done.
How does it work?
Division: Piles of Fixed Size (Works Great!)
We can nicely model 6 ÷ 3 = 2 by making piles of a fixed size
6 becomes the number of cards total.
3 becomes the number of cards per pile.
2 becomes the number of piles.
So the question is: How many piles do I make before I run out of cards?
This way of thinking does help us think about dividing by fractions.
Division: Piles of Fixed Size (Works Great!)
We can nicely model 6 ÷ 1⁄2 = 12 by making piles of a fixed size
6 becomes the number of cards total.
½ becomes the number of cards per pile. I rip each card in half!
12 becomes the number of piles.
The question still makes sense: How many piles do I make before I run out of cards?
The second way of thinking also allows us to understand why division by zero, which is undefined, is in a few situations treated as if the answer is infinity. If I had some cards and tried to make piles of size zero I can do this easily. I just never stop!
Your turn to think carefully about division.
(a) We can imagine dealing out 8 cards to 4 people. Each person gets 2 cards.
We can also imagine making 8 cards into piles of 4 cards. We make 2 piles before we run out of cards.
(b) Imagine having eight pieces of paper. We rip them into quarters, while setting those quarters down as "piles". We get 32 piles.
(c) ½ + ½ = 1. This is nothing more than what "one half" means!
(d) We can imagine dealing out ½ of a card to 2 people. Rip! Each person gets ¼ of a card.
We can also imagine making ½ of a card into piles of size 2 cards. We run out to soon. We can only make ¼ of a pile of that size.
(d) ¼
(e) Imagine having one piece of paper. We rip it into quarters, while setting those quarters down as "piles". We get 4 piles.
(f) Imagine having half a piece of paper. We rip it in half again, making quarters, while setting those quarters down as "piles". We get 2 piles.
How about some multiplication and division problems that some students try to memorize as separate rules, instead of merely understanding division well?
(a) 28
(b) 28
(c) 0
(d) undefined
(e) 10,000
(f) 1
Video example problems have three images to click on. You can see a video step-by-step answer, a written step-by-step answer, or only the answer. If you find yet more helpful videos, please let your instructor know so that this website can be updated and improved!
Khan Academy

Textbook Exercises for Thinking About Division
This list of recommended odd-numbered textbook problems is designed for a hypothetical student with a "typical" math background. If your math foundation is weak, do even more odd-numbered problems. If your math foundation is strong, do fewer.
Please read the advice on doing homework in the study skills page.
Section 1.6 (page 76) # 77, 79, 81
Section 2.1 (page 102) # 75, 77, 81, 83
Section 2.5 (page 139) # 55, 59
Our next step in thinking carefully about division is to visualize factors.
Definition
Factors are the numbers you multiply to get another number.
That is a slightly sloppy definition, but it is good enough.
We can look at a multiplication equation to find factors.
Factors of 15
3 and 5 are two of the factors of 15 because 3 × 5 = 15
1 and 15 are two more factors of 15 because 1 × 15 = 15
Some students find it helpful to think about factors by imagining all the ways to make a rectangle with blocks or coins.
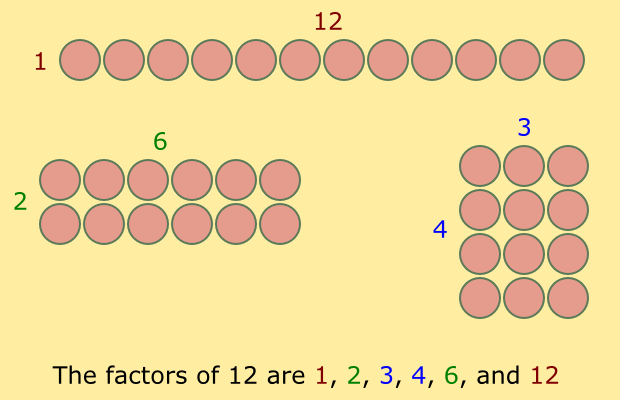
Note that 1 and the number itself are always factors!
Very soon we will look at shortcuts for finding factors. But we can do some problems with small numbers first to make sure we understand the definition.
The only factors are 1 and 5.
Definition
A prime numbers has no factors other than itself and 1.
The three factors are 1, 5, and 25.
Notice that the number 5 does appear twice in the equation 5 × 5 = 25. But we do not mention it twice when naming the factors.
The four factors are 1, 2, 3, and 6.
How would we find factors if we do not have multiplication equations handed to us?
We could just think hard, and maybe guess-and check.
Does 6 Work?
Is 6 a factor of 96?
Um...let me think...yes, because 6 × 16 = 96
But some tricks can help us.
Here are divisibility shortcuts you already know:
Here are divisibility shortcuts that might be new to you:
There are other divisibility tricks, but these are the ones that are easy enough to use to count as shortcuts.
Let's apply our divisibility shortcuts to 13,512.
Divisible by 2? Yes, because the one's place value digit is 2, which is even.
Divisible by 3? Yes, because the sum of digits is 1 + 3 + 5 + 1 + 2 = 12 and three goes into 12.
Divisible by 4? Yes, because two-digit number formed from its ten's and one's digits is 12 and four goes into 12.
Divisible by 5? No, because the one's place value digit is not zero or five.
Divisible by 6? Yes, because it was divisible by both 2 and 3.
Divisible by 9? No, because the sum of digits is 1 + 3 + 5 + 1 + 2 = 12 and nine does not go into 12.
Let's also apply our divisibility shortcuts to 2,016.
Divisible by 2? No, because the one's place value digit is 1, which is odd.
Divisible by 3? Yes, because the sum of digits is 8 + 6 + 6 + 1 = 18 and three goes into 18.
Divisible by 4? No, because two-digit number formed from its ten's and one's digits is 61 and four does not go into 61.
Divisible by 5? No, because the one's place value digit is not zero or five.
Divisible by 6? No, because it was not divisible by both 2 and 3.
Divisible by 9? Yes, because the sum of digits is 8 + 6 + 6 + 1 = 18 and nine goes into 18.
Let's also apply our divisibility shortcuts to 5,025.
Divisible by 2? No, because the one's place value digit is 5, which is odd.
Divisible by 3? Yes, because the sum of digits is 2 + 2 + 5 = 12 and three goes into 12.
Divisible by 4? No, because two-digit number formed from its ten's and one's digits is 25 and four does not go into 25.
Divisible by 5? Yes, because the one's place value digit is a zero or five.
Divisible by 6? No, because it was not divisible by both 2 and 3.
Divisible by 9? No, because the sum of digits is 1 + 3 + 5 + 1 + 2 = 12 and nine does not go into 12.
Let's also apply our divisibility shortcuts to 73,080.
Divisible by 2? Yes, because the one's place value digit is 0, which is even.
Divisible by 3? Yes, because the sum of digits is 7 + 3 + 8 = 18 and three goes into 18.
Divisible by 4? Yes, because two-digit number formed from its ten's and one's digits is 80 and four goes into 80.
Divisible by 5? Yes, because the one's place value digit is a zero or five.
Divisible by 6? Yes, because it was divisible by both 2 and 3.
Divisible by 9? Yes, because the sum of digits is 7 + 3 + 8 = 18 and nine goes into 18.
These divisibility shortcuts let us quickly find some factors.
Let's play the Factor Game! Here is a copy of the game board to use with an in-class demonstration.

Once you have played the Factor Game yourself, try to give advice in the following situation.
 Xavier and Odette are playing the Factor Game. Xavier is X's. Odette is O's. The board is shown below. It is Xavier's turn.
(a) If Xavier picks 15 then Odette cannot reply and he comes out ahead by 15 points.
(b) She picks 28 and Xavier replies with 14.
(c) The next turn Xavier would be able to pick 28 and she would be unable to reply.
Being able to find factors quickly will soon allow us to do fraction arithmetic more easily. But we have a bit more preparation to do.
There are two flavors of thorough factor finding. In some situations we want to find all the factors. In other situations we want to find the prime factors.
Finding all the factors will be useful when reducing a fraction.
Finding prime factors will useful when finding a common denominator for fractions.
Ready?
We find all the factors of a number by making a two-column list. Count 1, 2, 3,... in the first column. List any matching factors in the second column. When the columns get to the same value we can stop.
This time our first column counts up from 1 to 10. The, the next value for the first column would be 11, which is already listed in the second column. So we can stop.
1 66
2 33
3 22
4 not a factor
5 not a factor
6 11
7 not a factor
8 not a factor
9 not a factor
10 not a factor
So 66 has eight factors: 1, 2, 3, 6, 11, 22, 33, 66
24 has eight factors: 1, 2, 3, 4, 6, 8, 12, 24
60 has twelve factors: 1, 2, 3, 4, 5, 6, 10, 12, 15, 20, 30, 60
36 has nine factors (more): 1, 2, 3, 4, 6, 9, 12, 18, 36
40 has eight factors: 1, 2, 4, 5, 8, 10, 20, 40
36 = 6 × 6. When we made those two columns, the bottom number for both columns was the same, 6. So even though factors come in pairs, there is a special case where the "bottom" pair of factors is the same number repeated.
We find prime factors by making a factor tree and noting the "leaves".
Remember factor trees?
Here is one factor tree for 48.

Answers will vary.
We could start with 2 × 24 or with 3 × 16 or with 4 × 12.
We could also start by splitting 48 into three factors, such as 2 × 2 × 12 or 2 × 3 × 8.
Either circle or "bring down" the leaves of your factor tree so you do not make a careless mistake and forget any of them when writing your answer.
To be polite, list the prime factors in order. Write them as a product (separated by × symbols).
Definition
The ordered list of prime factors is called the prime factorization.
Optionally, you may show off your fluency with exponents by writing the prime factorization as compactly as possible using exponents.
With or Witout Exponents
For example, the prime factorization of 66 is 2 × 2 × 2 × 3.
Or you could be fancy and write the prime factorization of 66 as 23 × 3.
Looking at the factor trees for 48 we see the prime factorization is 2 × 2 × 2 × 2 × 3 = 48.
This can also be written as 24 × 3 = 48.
(a) 24 = 2 × 2 × 2 × 3
(b) 18 = 2 × 3 × 3
(c) 51 = 3 × 17
(d) 49 = 7 × 7
(e) 80 = 2 × 2 × 2 × 2 × 5
(f) 280 = 2 × 2 × 2 × 5 × 7
Video example problems have three images to click on. You can see a video step-by-step answer, a written step-by-step answer, or only the answer. If you find yet more helpful videos, please let your instructor know so that this website can be updated and improved!
Khan Academy
Divisibility Tests for 2, 3, 4, 5, 6, 9, 10
YouTube Problems


Identify the products and factors: 30 = 2 × 3 × 5 The answer to a multiplication problem is the product.
The amounts being multiplied are the factors.
So the product is 30, and the factors are 2, 3, and 5. The product is 30. The factors are 2, 3, and 5.
The amounts being multiplied are the factors.
So the product is 72, and the factors are 8 and 9. The product is 72. The factors are 8 and 9.
Does 9 go into 19? No.
So 9 does not go into our original number either. No.
Is this 0 or 5? Yes.
So 5 goes into our number. Yes.
Is this 0, 2, 4, 6, or 8? Yes.
So 2 goes into our number.
The sum of the digits is 2 + 3 + 2 + 2 = 9.
Does 3 go into 9? Yes.
So 3 goes into our original number also.
Both 2 and 3 work, so 6 also works. Yes.
1 × 300. 2 × 150. 3 × 100. 4 × 75. 5 × 60. 6 × 50. 7 doesn't work. 8 doesn't work. 9 doesn't work. 10 × 30. 11 doesn't work. 12 × 25. 13 doesn't work. 14 doesn't work. 15 × 20. 16 doesn't work. 17 doesn't work. 18 doesn't work. 19 doesn't work.
Now we are up to 20, a number that already appeared. We can stop. 1, 2, 3, 4, 5, 6, 10, 12, 15, 20, 25, 30, 50, 60, 75, 100, 150, 300
So you can write 2 × 3 × 3 or you can write 2 × 32 You can write 2 × 3 × 3, or you can write 2 × 32
So you can write 2 × 2 × 3 × 5 or you can write 22 × 3 × 5 You can write 2 × 2 × 3 × 5, or you can write 22 × 3 × 5
Textbook Exercises for Divisibility and Factors
This list of recommended odd-numbered textbook problems is designed for a hypothetical student with a "typical" math background. If your math foundation is weak, do even more odd-numbered problems. If your math foundation is strong, do fewer.
Please read the advice on doing homework in the study skills page.
Section 2.3 (page 117) # 9, 11, 13, 15
Negative numbers are less than than zero.
−5 is less than −2 even though 5 is more than 2.

A number line can help keep track whole numbers, mixed numbers, or numbers with decimal digits.
Here are 3.5 and −2.8 on a number line.

To add and subtract with both positive and negative numbers it is helpful to think of money.
One technique is to try making up a story to go along with each addition and subtraction problem.
Example of a Money Story Adding a Negative
Solve: 30 + (−12) =
Here is one possible story:
"I have $30 in my hand and am going shopping. I know that I owe my friend $12. A debt has been added. So in my mind I plan my shopping as if I had only $18, because that debt means $12 of the $30 is not mine to spend. So 30 + (−12) = 18."
Example of a Money Story Subtracting a Negative
Solve: 18 − (−12) = ?
Here is one possibility:
"I am about to go shopping to spend $18. I owe my friend $12 and have that money with me too. But when I finally see my friend he says, 'Never mind the debt. It's been seven years anyway. Just keep the $12.' A debt has been removed. So I change how I think about the money. I don't have only $18 to spend, but all $30. So 18 − (−12) = 30."
Instead of a story, you can also use a number line to keep track of adding and subtracting with both positive and negative numbers.

Start at 4. Go left 6, left 3 more, then right 10, then left 3½. The answer is 1½ or 1.5.
Remember from the equation 18 − (−12) = 30 that subtracting a negative worked just like adding. I get more money, whether I am paid or have a debt subtracted away.
There is a saying that goes "a negative of a negative is a positive". Why is this true?
Imagine that the front wall of our room is a number line. Zero is in the middle. Now we need a student to volunteer to show us by walking the values of +3 and −3.
Draw a number line. Have a volunteer stand at "zero", facing positive, before continuing.
How would our volunteer show us +3?
He or she would walk forward 3 steps. Note that this location along the front wall represents +3 on our number line.
How would our volunteer show us −3?
He or she would walk backwards 3 steps. Note that this location along the front wall represents −3 on our number line.
How else could our volunteer show us −3, without any backward steps?
He or she could pivot 180 degrees, and then walk forwards 3 steps. Note that results in the same location along the front wall representing −3 on our number line.
What happens if our volunteer does both kinds of negative? That is, if he or she represents −(−3) by both turning around 180 degrees and then taking three backwards steps?
Our volunteer winds up at the +3 location on our number line. This is another way to see that − (−3) = 3.
Using arithmetic, a number is made negative by × (−1)
Consider the expression 10 − x.
If we plug in x = 20 then we get 10 − 20 = −10.
If we plug in x = −20 then we get 10 − (−20) = 30.
So, is the expression 10 − x positive or negative?
It depends upon what we plug in to x!
In general, it does not make sense to say that x is positive or negative. It depends upon what we plug in to x.
This is why in college math we write −5 instead of ⁻5. Once we use variables instead of normal numbers, then every time we see a − sign we are subtracting, but it might not be negative!
That is a very weird statement!
The Very Weird Statement
Once we use variables instead of normal numbers, then every time we see a − sign we are subtracting, but it might not be negative!
Compare the mathematical expression 5 − x and the mathematical expression 7 − (−x). Both involve subtraction. Neither necessarily involves a negative amount.
None yet
Textbook Exercises for Variables and Negatives
This list of recommended odd-numbered textbook problems is designed for a hypothetical student with a "typical" math background. If your math foundation is weak, do even more odd-numbered problems. If your math foundation is strong, do fewer.
Please read the advice on doing homework in the study skills page.
Section 10.1 (Page 529) # 3, 5, 23, 27, 81, 83, 93, 95, 97
Section 10.2 (Page 537) # 3, 5, 11, 13, 49, 57, 59
Section 10.3 (Page 544) # 5, 7, 9, 11, 47, 49, 51, 55, 65, 67, 69, 75
How do we do fraction multiplication? Let's use some pictures to get a sense of what happens.
Use the picture below to show multiplying one-third by one-half. This picture starts with three vertical "cake cuts" and one-third shaded. Put the one-half in the picture by making a horizontal "cut" across the middle, and shading either above or below our horizontal cut.

one-sixth
How many pieces is the cake cut into?
How many pieces are shaded? Or after multiplying, how many pieces are overlap-shaded?
To paraphrase, how many pieces do we bundle together into a group? In this problem there was no bundling. Each direction (horizontal or vertical) had only one shaded piece.
Use the picture below to show multiplying two-thirds by three-quarters. This time you must prepare the picture by drawing the two-thirds yourself. Use different types of shading for two of the thirds and for three of the quarters.

six-twelfths
The same thing: how many pieces is the cake cut into?
The same thing: how many pieces are shaded? Or after multiplying, how many pieces are overlap-shaded?
To paraphrase, how many pieces do we bundle together into a group? In this problem there was bundling. When we cut thirds, two of those were bundled together. When we cut fourths, three of those were bundled together.
Definition
To multiply fractions, treat the situation as two independent multiplication problems. Multiply the numerators. Multiply the denominators.
The answer will be a fraction that may or may not need to be reduced.
We call this process the fraction multiplication algorithm.
The word algorithm is merely a fancy word for "recipe" or "process". It describes the steps to follow to do a task.
Here is an example where the answer does not need to be reduced.
In the numerators, 2 × 7 = 14. In the denominators, 3 × 5 = 15. So our answer is 14⁄15.
Here is an example where the answer does need to be reduced.
Using reducing: In the numerators, 5 × 1 = 5. In the denominators, 7 × 10 = 70. So our answer is 5⁄70, which can be reduced to 1⁄14.
Definition
During fraction multiplication, canceling is reducing early.
(This definition is not an algorithm. It defines a word. But it does not list the steps for a recipe or process.)
Canceling avoids big numbers when multiplying. Let's review it with an example.
Using canceling: We can divide by five in the first numerator and second denominator. Then 1⁄7 × 1⁄2 = 1⁄14.
We cannot escape dividing both numerator and denominator by 5. But can chose to do it before or after multiplying.
Your turn. Here are two more examples. Attempt them before we do them together. (If you have time, try doing this problem both ways: once with reducing and once with canceling.)
Using reducing: In the numerators, 3 × 1 = 3. In the denominators, 5 × 12 = 60. So our answer is 3⁄60, which can be reduced to 1⁄20.
Using canceling: We can divide by three in the first numerator and second denominator. Then 1⁄5 × 1⁄4 = 1⁄20.
Using reducing: In the numerators, 6 × 2 = 12. In the denominators, 11 × 3 = 33. So our answer is 12⁄33, which can be reduced to 4⁄11.
Using canceling: We can divide by three in the first numerator and second denominator. Then 2⁄11 × 2⁄1 = 4⁄11.
This example is quite important, because in shows how canceling can get a little complicated.
Using reducing: In the numerators, 10 × 6 = 60. In the denominators, 15 × 8 = 120. So our answer is 60⁄120, which can be reduced to 1⁄2.
Using canceling: We can divide a numerator and denominator by 5. (Yes, it is okay when "canceling" is merely reducing one of the fractions without touching the other.) Twice we can divide a numerator and denominator by 2. (Both times involve the denominator that starts out 8.) We can divide a denominator and numerator by 3. Then 1⁄1 × 1⁄2 = 1⁄2.
How do we multiply a fraction by a mixed number?
After we change 1 4⁄8 into 12⁄8 we are solving 2⁄3 × 12⁄8.
Then, in the numerators, 2 × 12 = 24. In the denominators, 3 × 8 = 24. So our answer is 24⁄24, which can be reduced to 1. (Or you could use canceling.)
Change 1 2⁄3 into 5⁄3, as well as changing 1 4⁄8 into 12⁄8.
Now we are solving 5⁄3 × 12⁄8.
Then, in the numerators, 5 × 12 = 60. In the denominators, 3 × 8 = 24. So our answer is 60⁄24, which can be reduced to 5⁄2. (Or you could use canceling.)
Remember when we explained division as making piles of a fixed size? We did fraction division problems like these:
Review of Division as Making Piles of a Fixed Size
1⁄2 ÷ 1⁄4 =
Imagine having half a piece of paper. We rip it in half again, making quarters, while setting those quarters down as "piles". We get 2 piles.
So 1⁄2 ÷ 1⁄4 = 2
4 ÷ 2⁄3 =
Imagine having 4 pieces of paper. We rip each in thirds while setting pairs of thirds down as "piles". We make 12 thirds by ripping. So we get 6 piles of two-thirds.
So 4 ÷ 2⁄3 = 6
Now what is happening to the numerators and denominators?
When we played with cake above, the denominators counted the number of pieces. The second numerator is also doing this.
For example, in 4 ÷ 2⁄3 = 6 the 3 meant each of the four wholes was ripped into 3 pieces.
When we played with cake above, the numerators counted the number of shaded parts in a group. The second denominator is also saying how many pieces made a group.
For example, in 4 ÷ 2⁄3 = 6 the 2 meant each of the piles bundled together 2 of the ripped thirds.
Definition
To divide fractions, flip the second fraction and multiply.
(Remember to reduce if needed.)
This definition is another algorithm. It describes the steps of a process. We can name it the fraction division algorithm.
Let's review fraction division with examples.
1⁄2 ÷ 3⁄4 = 1⁄2 × 4⁄3 = 2⁄3
3⁄5 ÷ 1⁄10 = 3⁄5 × 10⁄1 = 6
6⁄9 ÷ 2⁄3 = 6⁄9 × 3⁄2 = 1
10⁄15 ÷ 6⁄8 = 10⁄15 × 8⁄6 = 8⁄9
5⁄3 ÷ 10⁄8 = 5⁄3 × 8⁄10 = 4⁄3
Video example problems have three images to click on. You can see a video step-by-step answer, a written step-by-step answer, or only the answer. If you find yet more helpful videos, please let your instructor know so that this website can be updated and improved!
The Organic Chemistry Tutor
Multiplying Fractions - The Easy Way!
YouTube Problems
Changing these YouTube problems into a trio of links for video, steps, and only the answer is a lot of work. This is as far as I have gotten.
Are you using these? Does the textbook's videos for every example problem make this idea obsolete?
Chapter 2 Test, Problem 25: Simplify: 5 × 3⁄10
Chapter 2 Test, Problem 26: Simplify: 2⁄3 × 15⁄4
Chapter 2 Test, Problem 27: Simplify: 22⁄15 × 5⁄33
Chapter 2 Test, Problem 31: Simplify: 1⁄5 ÷ 1⁄8
Chapter 2 Test, Problem 32: Simplify: 12 ÷ 2⁄3
Chapter 2 Test, Problem 33: Simplify: 24⁄5 ÷ 28⁄15
Textbook Exercises for Fraction × and ÷
This list of recommended odd-numbered textbook problems is designed for a hypothetical student with a "typical" math background. If your math foundation is weak, do even more odd-numbered problems. If your math foundation is strong, do fewer.
Please read the advice on doing homework in the study skills page.
Section 2.4 (Page 128) # 1, 3, 7, 11, 13, 21, 27, 29
You probably know that we need to have common denominators when adding fractions.
The denominator of a fraction acts like a word describing the type of thing we are considering. The fraction 3⁄4 says "I am considering fourths, and care about three of them."
In this way, "three-fourths" is very similar to the phrases "3 inches" or "3 centimeters".
Because of how denominators are conceptually like labels, trying to add fractions with unlike denominators works as badly as trying to add inches and centimeters. We need to change the fractions so their numerators are counting the same type of thing. We need to make their denominators match.
Consider the cake below. Amy gets to eat the big shaded half. Beatrice gets to eat the smaller shaded fourth. How much of the cake have they eaten?

We cannot combine the shaded half and fourth into a single thing without changing one of them to match the other.
Yes.
We could change both to halves. Then we would say they ate 1 1⁄2 halves.
We could change both to quarters. Then we would say they ate 3 quarters.
The answer "3 quarters" is a lot more friendly than the answer "1 1⁄2 halves".
Tangentially, how did fraction multiplication avoid the need for common denominators? Ponder that sometime, until you have a satisfying answer. Here is a clue.
Try using the picture below to show adding one-third and one-half. This picture starts with all the "cake cuts" going in one direction, and one-third shaded. Put the one-half in the picture by making a "cut" in the other direction. Then try to also shade the top or bottom half to add its amount without double-counting any of the shaded pieces.

No. We get stuck because a portion of the half is already shaded! What should we do?
What should we do about a portion of the half already being shaded?
We need to "wrap around" as we shade in the half. This means we were forced to be aware that we are using sixths before looking for our final answer. The process itself requires sixths.
For the similar fraction multiplication problem earlier, we did not need to think about the new denominator until after the process is complete, when we are ready to write our answer. The process itself did not require sixths. Only naming our answer did.
When we ask with addition, "How much is one-half more than one-third?" then overlapping the shaded pieces is not allowed.
When we ask with multiplication, "How much is one-half of than one-third?" then the overlap is our answer.
See the difference?
When we change the denominators of two fractions so they match, there are three situations.
Sometimes one denominator is a multiple of the other.
Twelve is a multiple of six.
We only have to change the one-sixth.
We un-reduce 1⁄6 × 2⁄2 = 2⁄12
This example is like the cake pieces Amy and Beatrice ate. We should chop up the larger-size piece so it matches the smaller-size piece.
Sometimes the denominators have no common factors.
Fourteen and fifteen have no common factors.
We have to change both fractions.
We un-reduce 1⁄14 × 15⁄15 = 15⁄210
We un-reduce 1⁄15 × 14⁄14 = 14⁄210
We can always "brute force" a common denominator by multiplying the two denominator numbers.
In this example the "brute force" technique is the best we can do.
Definition
Two or more numbers are relatively prime if they have no common factors except for 1.
(Is this definition is an algorithm? Why or why not?)
For fractions with relatively prime denominators, the "brute force" technique will always be the best we can do.
Sometimes the denominators have factors in common, but neither is a multiple of the other.
Twelve and fifteen have a common factor of three.
We have to change both fractions.
We un-reduce 1⁄12 × 5⁄5 = 5⁄60
We un-reduce 1⁄15 × 4⁄4 = 4⁄60
In this example the "brute force" technique is not what we want. There is a common denominator less than 12 × 15 = 180.
We could use 180. But whenever we use a needlessly large common denominator we will eventually do more reducing than otherwise.
Definitions
When we look at a group of two or more fractions, the smallest number we can un-reduce every denominator to match is the least common denominator.
How do we find it? It will be the least common multiple of the starting denominators.
(Are these definitions algorithms? Why or why not?)
If we use the least common denominator we might have to reduce our answer. But it is no longer a step that will always be needed.
Hm. We will need to find least common multiples. How do we do that?
The simplest method is to simply start making a list of multiples for each number. The smallest number the lists have in common is our answer.
Multiples of 10 are 10, 20, 30, 40, 50, 60, 70, ...
Multiples of 12 are 12, 24, 48, 60, 72, ...
Multiples of 15 are 15, 30, 45, 60, 75, ...
In that example we picked 60 for our answer because it was the smallest number on every list.
The quickest method is to write the prime factorization of each number (the long way, do not use exponents to condense your answer), merge factors shared in two or more prime factorizations, and then multiply the surviving factors.
The prime factorization of 10 is 2 × 5. The prime factorization of 12 is 2 × 2 × 3. The prime factorization of 15 is 3 × 5
The least common multiple is 2 × 2 × 3 × 5 = 60
In that example we merged the green 2s, the red 3s, the blue 5s. Every time a factor appears in more than one prime factorization we smoosh together one instance of it from each prime factorization that has it. Notice that the second 2 in the prime factorization of 12 was not merged. Neither of the other prime factorizations also had a 2 to smoosh it with.
Multiples of 24 are 24, 48, 72, 96, 120, 144, 168, ...
Multiples of 36 are 36, 72, 108, 144, 180, ...
Multiples of 48 are 48, 96, 144, 192, ...
The prime factorization of 24 is 2 × 2 × 2 × 3. The prime factorization of 36 is 3 × 2 × 2 × 3. The prime factorization of 48 is 2 × 2 × 2 × 2 × 3
We merge the red 2s because they appear in more than one prime factorization. And we merge the green 2 × 2 × 3 because it appears in more than one prime factorization. There is also an unmerged 2 and an an unmerged 3.
The least common multiple is 2 × 3 ×2 × 2 × 2 × 3 = 144
Those examples were pretty tricky because we found the least common multiple of three numbers. Most of the time when we add fractions we are only adding two fractions. Finding the least common multiple of two numbers will be a lot easier!
Let's do the same fraction addition problem in three different ways.
The first method we'll nickname the brute force method. We find a new denominator very quickly be multiplying each old denominator by the other. This always works, but forces us to deal with large numbers.
We un-reduce 1⁄30 × 42⁄42 = 42⁄1,260
We un-reduce 1⁄42 × 30⁄30 = 30⁄1,260
Then we add 42⁄1,260 + 30⁄1,260 = 72⁄1,260 = 2⁄35
We started quickly! We could rush right into un-reducing the two fractions. But then we had to do a lot of work reducing 72⁄1,260 to get our final answer.
The second method is using the list of multiples method to find the least common denominator. This method is slow, but is favored by some students who prefer to work with multiples instead of factors.
Multiples of 30 are 30, 60, 90, 120, 150, 180, 210, 240, ... So we change 1⁄30 into 7⁄210 (Notice that 210 is the seventh multiple in the list.)
Multiples of 42 are 42, 84, 126, 168, 210, 252, ... So we change 1⁄42 into 5⁄210 (Notice that 210 is the fifth multiple in the list.)
Then we add 7⁄210 + 5⁄210 = 12⁄210 = 2⁄35
We started slowly, finding lists of multipes. But we had a lot less reducing at the end!
The third method is using the prime factorization method to find the least common denominator. This method is quickest for students who can think quickly about factors.
The prime factorization of 30 is 2 × 3 × 5. The prime factorization of 42 is 2 × 3 × 7.
We merge the green 2 × 3. There is also an unmerged 5 and an an unmerged 7. So the least common multiple is 2 × 3 × 5 × 7 = 210.
Then we add 1⁄30 + 1⁄42 = 7⁄210 + 5⁄210 = 12⁄210 = 2⁄35
Notice in that last example that we had hints about how to un-reduce the numerators of our starting gractions: the unmerged factor(s) from the other prime factorization!
Time for a few more examples. You try these before seeing the instructor's work. Use any of the three methods.
1⁄36 + 1⁄6 = 1⁄36 + 6⁄6 = 7⁄36
3⁄4 − 1⁄12 = 9⁄12 − 1⁄12 = 8⁄12 = 2⁄3
1⁄5 + 1⁄4 = 4⁄20 + 5⁄20 = 9⁄20
1⁄12 + 2⁄15 = 5⁄60 + 8⁄60 = 13⁄60
5⁄42 − 1⁄24 = 20⁄168 − 7⁄168 = 13⁄168
Note that the same techniques work when we have more than two fractions. The problem just takes longer because it is more work to find the prime factorization of more than two numbers.
1⁄4 + 1⁄6 − 1⁄15 = 15⁄60 + 10⁄60 − 4⁄60 = 21⁄60 = 7⁄20
MathemARTics
How to find the LCM from prime factors and factor trees
Bittinger Chapter Tests, 11th Edition
Chapter 3 Test, Problem 3: Simplify: 1⁄2 + 5⁄2
Chapter 3 Test, Problem 4: Simplify: 7⁄8 + 2⁄3
Chapter 3 Test, Problem 5: Simplify: 7⁄10 + 19⁄100 + 31⁄1,000
Chapter 3 Test, Problem 6: Simplify: 5⁄6 − 3⁄6
Chapter 3 Test, Problem 7: Simplify: 5⁄6 − 3⁄4
Chapter 3 Test, Problem 8: Simplify: 17⁄24 − 1⁄15
Textbook Exercises for Fraction + and −
This list of recommended odd-numbered textbook problems is designed for a hypothetical student with a "typical" math background. If your math foundation is weak, do even more odd-numbered problems. If your math foundation is strong, do fewer.
Please read the advice on doing homework in the study skills page.
Section 3.2 (Page 159) # 1, 5, 9, 13, 21, 23, 27, 29, 33, 35, 39, 47, 51, 55
There are two ways to think about subtracting with mixed numbers.
We could treat the fractions as a place value column and borrow from the 1's column if we need to do so.
Subract the whole numbers and fractions separately, then squish the answers together.
3 1⁄2 − 2 1⁄4 = 3 − 2 and then 1⁄2 − 1⁄4 = 1 and then 1⁄4 = 1 1⁄4
Subract the whole numbers and fractions separately, then squish the answers together.
5 1⁄4 − 3 1⁄2 = 5 1⁄4 − 3 2⁄4 = 5 − 3 and then 1⁄4 − 2⁄4. We get stuck with not enough fourths to start that subtraction!
We borrow from the whole numbers by changing 5 into both 4 and 4⁄4.
Now we have plenty of fourths: the one we started with and four more (so five total)
So 4 − 3 = 1 and then 5⁄4 − 2⁄4 = 3⁄4, for a final answer of 1 3⁄4
We could change both mixed numbers to improper fractions and then subtract.
3 1⁄2 − 2 1⁄4 = 7⁄2 − 9⁄4 = 14⁄4 − 9⁄4 = 5⁄4
5 1⁄4 − 3 1⁄2 = 21⁄4 − 7⁄2 = 21⁄4 − 14⁄2 = 7⁄4
It is helpful to be fluent with both these methods of subtracting mixed numbers. For some problems the first method will be easier. For other problems the second method will be easier.
Notice that treating the fractions as a place value column naturally resulted in a mixed number answer, whereas changing both mixed numbers to improper fractions naturally resulted in an improper fraction answer.
Bittinger Chapter Tests, 11th Edition
Chapter 3 Test, Problem 19: Simplify: 10 1⁄6 − 5 7⁄8
Textbook Exercises for Mixed Number Subtraction
This list of recommended odd-numbered textbook problems is designed for a hypothetical student with a "typical" math background. If your math foundation is weak, do even more odd-numbered problems. If your math foundation is strong, do fewer.
Please read the advice on doing homework in the study skills page.
Section 3.3 (Page 170) # 1, 9, 13, 21, 29, 49, 51, 53, 55
Many math students are taught to memorize the acronym PEMDAS to help solve resolve order of operations.
PEMDAS
P = Parenthesis
E = Exponents
M = Multiplication
D = Division
A = Addition
S = Subtraction
This acronym can be very helpful if it was taught well.
Unfortunately, PEMDAS can cause problems if it was taught poorly.
Which answer for 8 ÷ 4 × 2 is Correct?
Do the 4 × 2 first because M comes before D
8 ÷ 4 × 2 = 8 ÷ 4 × 2 = 8 ÷ 8 = 1
or
Do the 8 ÷ 4 first because we go left to right
8 ÷ 4 × 2 = 8 ÷ 4 × 2 = 2 × 2 = 4
The second is correct. Multiplication and division have equal priority, and should be done left-to-right.
To solve an order of operations problem we cannot simply do P-E-M-D-A-S in order! This is because some operations have equal priority. These must be done left-to-right when only these are left to do.
Multiplication and division have equal priority.
Addition and subtraction have equal priority.
Stay alert!
Also note that PEMDAS does not tells us what to do with fractions. Fraction bars are actually another grouping symbol, just like parenthesis. We could rewrite fractions problems as parenthesis problems.

We could try to "fix" PEMDAS by rewriting it.
(PF)E(MD)(AS)
PF = Parenthesis and Fraction Bars
E = Exponents
MD = Multiplication and Division
AS = Addition and Subtraction
Parenthesis and fraction bars have first priority. Then exponents. Then multiplication and division. Then addition and subtraction. Work from left to right with items of equal priority.
Unfortunately, this is stupidly awkward. There must be something better!
The best way to deal with order of operations is to not replace the (AS) step of PEMDAS with a new kind of thinking.
Terms
A term is an portion of an expression separated from the equal sign only by addition or subtraction.
How many terms are in these expressions? (Hint: Try underlining them.)
(4 + 2) ÷ 3 + 8 × 22 =
Two. They are separated by the only + symbol outside of parenthesis.
1⁄2 × 4 × 5 − 3 × (9 − 1) ÷ 22 + 5 =
Three. The first stops at the − symbol outside of parenthesis. The final 5 is its own term.
11 + 8 × 2 − 14 ÷ 7 + (19 − 4) ÷ 3 − 90 ÷ 32 =
Five.
Why are terms the easiest way to think about order of operations?
First, each term is totally independent until as the very last step we combine them. It does not matter which term we simplify first.
Second, within a term we only have two priorities: first grouping structures (parenthesis, fraction bars, and exponents) and then going left-to-right with multiplication and division.
As a tangential comment, exponents are not actually grouping structures, but they demand using them. When we see an exponent we must know clearly how much it covers. So mathematicians include exponents when talking about grouping structures.
Consider the expression (3 + 2)2. It is different from the expressions (3 + 22) and 32 + 22. Wanting to square the sum of 3 + 2 demanded putting parenthesis around that sum.
Now we should actually simplify those three expressions.
(4 + 2) ÷ 3 + 8 × 22 =
2 + 32 = 34
1⁄2 × 4 × 5 − 3 × (9 − 1) ÷ 22 + 5 =
10 − 6 + 5 = 9
11 + 8 × 2 − 14 ÷ 7 + (19 − 4) ÷ 3 − 90 ÷ 32 =
11 + 16 − 2 + 5 − 10 = 20
As one last comment about terms, remember that we can cancel factors but we cannot cancel terms.

Bittinger Chapter Tests, 11th Edition
Chapter 1 Test, Problem 41: Simplify: 35 − 1 × 28 ÷ 4 + 3
Chapter 1 Test, Problem 42: Simplify: 102 − 22 ÷ 2
Chapter 1 Test, Problem 43: Simplify: (25 − 15) ÷ 5
Chapter 1 Test, Problem 44: Simplify: 24 + 24 ÷ 12
Chapter 4 Test, Problem 50: Simplify: 256 ÷ 3.2 ÷ 2 − 1.56 + 78.325 × 0.02
Chapter 4 Test, Problem 51: Simplify: (1 − 0.08)2 + 6 × [5 × (12.1 − 8.7) + 10 × (14.3 − 9.6)]
Textbook Exercises for Order and Terms
This list of recommended odd-numbered textbook problems is designed for a hypothetical student with a "typical" math background. If your math foundation is weak, do even more odd-numbered problems. If your math foundation is strong, do fewer.
Please read the advice on doing homework in the study skills page.
Section 1.7 (Page 84) as much of # 27-73 odd as helps you, 77, 79, 81
Section 2.4 (Page 129) # 31, 43, 45, 47, 49, 51
Section 3.4 (Page 178) # 1, 3, 9, 13, 39, 41, 43, 45, 51
Try these ten exercises on scratch paper. Work in a study group if you can! Notice where your notes need improvement. After you are very happy with your answers, you can use this form to ask me to check your work. Can you get at least 8 out of 10 correct?
1. A cookie recipe calls for 2⁄3 cup of flour. If you are making a double batch, how much flour will you use?
2. What is four-fifths times twenty?
3. What is four-fifths times two-thirds?
4. What is two-thirds divided by three-halves?
5. 22⁄15 ÷ 33⁄5 =
6. What is the least common multiple of 12 and 18?
7. What is five-sixths plus three-fourths?
8. What is five-sixths minus three-fourths?
9. A piece of fabric that is 1 3⁄4 yards long is cut into seven equal pieces. How long is each piece?
10. Grandma Jorgensen left 2⁄3 of her 7⁄8 pound silver bullion bar to her son Lloyd. Lloyd gave each of his four children a 1⁄4 share. How much silver did each of Lloyd's children receive?
Try these exercises on scratch paper. Work in a study group if you can! Notice where your notes need improvement. Check your work when you are done.
The word of in a word problem tells us to multiply.
This makes sense. Making copies is what multiplication does. When visiting a candy store, when you tell the clerk "I would like ten of those" then you are saying "I would like ten copies of one of those".
$25 × 5 = $125
The phrase "5 of them" turned into × 5.
7 minutes × 30 = 210 minutes
The phrase "a class of 30" turned into × 30.
The way the English language works also makes it very natural to put the word "of" into a word problem with a fractional amount.
350 total × 3⁄7 are boys = 150 boys
The phrase "three-sevenths of the children" turned into × 3⁄7.
3⁄8 remaining × 1⁄2 of that = 3⁄16 of a pizza
The phrase "one-half of what is left" turned into × 1⁄2.
The third occasion when the English language naturally uses "of" to mean multiplication is with the phrase "percent of..."
Use RIP LOP to change the percentage into a decimal. Then multiply.
200 × 0.4 = 80
The phrase "40% of..." turned into × 0.4.
The "Percent Of..." Algorithm
When we are asked to find the percentage of an amount, we can use RIP LOP on the percentage and then multiply.
The amount could be a normal number.
200 × 0.6 = 120
The amount could be a labeled amount.
50 hours × 0.44= 22 hours
The amount could even be another percentage. Treat the other percertage symbol as a label.
50 percent × 0.1 = 5 percent = 5%
When comparing "percent of..." answers be wary of when they have the same or different initial amounts.
The initial amount in the first claim is "all Americans" which includes children. And the percentage measures how many have any health insurance.
The initial amount in the first claim is "adult Americans" which is a smaller group. And the percentage measures how many have one kind of health insurance.
The two claims are not compatible.
Here is a trick that allows you to solve more "percent of..." problems without needing to use a calculator. Impress your friends!
Remember that when multiplying two number the order of the numbers does not matter. Also remember that "percent" merely means to divide by 100 at the end. Let's put these two facts together.
Definition
The Switcheroo Trick says that when multiplying a number in percent format by a normal number we can switch which number is the percentage.
As an example, we can solve "What is 4% of 50?" by doing 4% × 50. However, finding 4% of a number might be tricky for you without a calculator. But finding 50% is easy—that is half of the number. So we switch which number is the percentage. 4 × 50% = 2.
We can switcheroo to ask, "What is 25% of 24?" Then with mental arithmetic we can more easily see that one-quarter of 24 is 6.
We can switcheroo to ask, "What is 900% of 8?" Then with mental arithmetic we can more easily see that 9 times 8 is a $72 discount.
A common application for "percent of..." word problems is tipping at a restaurant. You can learn a few shortcuts to impress your friends.
Before continuing, make sure you are not confused. We know that being in percent format is equivalent to two decimal point scoots. Why does the shortcut for finding 10% only involve only one decial point scoot?
Have you figured that out?
When we find 10% we end up multipying by × 0.1
We know from our examination of decimal point scoots that × 0.1 is the same as one scoot to the left.
Let's practice using those shortcuts.
10% of $25 becomes $25 × 0.1 = $2.50
But we want 20% instead of that 10%, so to get twice as much we double the 10% result and get a $5 tip.
10% of $20 becomes $20 × 0.1 = $2
Next we see that 5% of $20 is half that, which is $1
But we want 15% so we combine the 10% result and the 5% result and get a $3 tip.
10% of $30 becomes $30 × 0.1 = $3.00
Next we see that 5% of $30 is half that, which is $1.50
But we want 15% so we combine the 10% result and the 5% result and get a $4.50 tip.
Notice that the word "of" did not appear in the previous problem. But we could rephrase the problems to ask "What is 15% of $30?"
In other words, merely having the option to rephrase a situation using the phrase "percent of..." is still an instruction to multiply.
Tipping is one instance when estimation is very useful. If my restaurant bill was $21.87, the tip will not change much if I estimate based on $22.00.
Estimate by using $40 for the meal cost.
10% of $40 becomes $40 × 0.1 = $4
But we want 15% so we use one-and-a-half that result and get a $6 tip.
Estimate by using $24 for the meal cost.
10% of $24 becomes $24 × 0.1 = $2.40
But we want 20% so we double that result and get a $4.80 tip.
Another common application for "percent of..." word problems is a retail item that goes on sale with a percentage price reduction.
20% of $12 becomes $12 × 0.2 = $2.40 discount
35% of $60 becomes $60 × 0.35 = $21 reduction
Price reductions are another situation where estimation is very useful.
Estimate by using $80 for the jacket cost.
60% of $80 becomes $80 × 0.6 = $48 reduction
Notice that the word "of" did not appear in the previous two problems. But we could rephrase the problems to ask "What is 35% of $60?" and "Estimate 60% of $79.99."
Once again, merely having the option to rephrase a situation using the phrase "percent of..." is still an instruction to multiply.
All of these "percent of..." problems told us a percentage. We were multiplying that percentage by an amount.
It is possible to write an English sentence using the words "percent of..." that asks for the percentage instead. This is a different type of problem. We will learn about it later.
Guppies—Asking for the Percentage
In a tank of 10 fish, 8 are guppies. What percent of the fish are guppies?
Notice that this problem did not tell us a percentage. The "percent of..." algorithm does not work. There is no percentage to RIP LOP as the first step of that algorithm.
The Organic Chemistry Tutor
Textbook Exercises for Percent Of
This list of recommended odd-numbered textbook problems is designed for a hypothetical student with a "typical" math background. If your math foundation is weak, do even more odd-numbered problems. If your math foundation is strong, do fewer.
Please read the advice on doing homework in the study skills page.
(Our textbook has no exercises for this topic.)
Many retail sale situations ask you to find the percentage.
Compared to the problems we just did, we are working backwards. So we do the opposite of multiplying, which is dividing. And instead of starting with RIP LOP we finish with RIP LOP.
Think of 15¢ and 75¢ as being a part and whole.
Perhaps imagine the fraction 15¢⁄75¢
Then 15¢ ÷ 75¢ = 0.2 = 20% decrease
Often the monetary amount of the decrease is hidden. We must subtract to find it.
The decrease is 80¢ − 60¢ = 20¢
Perhaps imagine the fraction 20¢⁄80¢
Then 20¢ ÷ 80¢ = 0.25 = 25% decrease
To avoid confusion, it is helpful to memorize a formula.
Percent Change Formula
percent change = change ÷ original
Then use RIP LOP to change the decimal answer into percent format.
This definition is an algorithm dressed up as a formula. The steps of the algorithm are "change ÷ original". We can write those steps as a formula by putting in front "percent change =". Notice that any formula of similar structure, which says "your answer is what happens when you correctly simplify this expression" is an algorithm dressed up as a formula.
This formula reminds us to find the change if the word problem is worded to only give us the old and new values. It also reminds us to divide by the original instead of dividing incorrectly by the new value.
The percent change formula works for increases as well as decreases.
We do change ÷ original = $15,000 ÷ $120,000 = 0.125 = 12.5% increase
So far so good. Unfortunately, the word problems get trickier.
We already saw one issue to keep us on our toes: problems can show or hide the numeric amount of the change.
The increase is $170,000 − $150,000 = $20,000.
Then change ÷ original = $20,000 ÷ $150,000 ≈ 0.13 = 13% increase
Also, some problems ask for the change, but others ask for the change combined with the original amount.
3% of $200 becomes $200 × 0.03 = $6 increase
3% of $200 becomes $200 × 0.03 = $6 increase
Then add $200 + $6 = $206 new value
Let's do a variety of problems to make sure you understand how the wording can ask for different things.
5% of 163,000 becomes 163,000 × 0.05 = 8,150 increase
Then add 163,000 + 8,150 = 171,150 people for the new value
The increase as a number was 163,000 − 145,000 = 18,000 people
So the percent change is change ÷ original = 18,000 ÷ 145,000 ≈ 0.12 = 12% increase
First we change the ounces to pounds. 40 ounces ÷ 16 ounces per pound = 2.5 pounds
Then we find the current price, which is 80% of $24. $24 × 0.8 = $19.20
Then we find the unit rate by dividing. $19.20 ÷ 2.5 = $7.68 per pound
12% of $100 becomes $100 × 0.12 = $12 increase
Then add $100 + $12 = $112 new value
Here is a diagram to help us remember both issues when doing "percent change..." problems.

Plettski Productions Math
Percent of Increase and Decrease
Mathispower4u
Determine a Percent of Change (Decrease)
Determine a Percent of Change (Increase)
Bittinger Chapter Tests, 11th Edition
Chapter 6 Test, Problem 9: The number of foreign children adopted by Americans declined from 20,679 in 2006 to 19,292 in 2007. Find the percent of the decrease.
Chapter 6 Test, Problem 13: The marked price of a DVD player is $200 and the item is on sale for 20% off. What are the discount (in dollars) and sale price?
Chapter 6 Test, Problem 19: A television that normally costs $349 is on sale for $299. What is the discount in dollars? What is the discount rate?
Textbook Exercises for Percent Change
This list of recommended odd-numbered textbook problems is designed for a hypothetical student with a "typical" math background. If your math foundation is weak, do even more odd-numbered problems. If your math foundation is strong, do fewer.
Please read the advice on doing homework in the study skills page.
Section 6.5 (Page 347) # 1, 3, 9, 11, 13, 15, 17
Notice that in the previous problem, when we calculated $100 original value × 0.12 rate = $12 change, the initial amount of $100 was used but then disappeared. We had to add it back as a second step.
What if it did not disappear?
We know that multiplying any number by 1 does not change it. Let's use that.
The One Plus Trick
When we multiply by a percentage increase, we can first add 1 to that percentage to keep the original amount around.
So we can redo the previous problem as $100 original value × 1.12 rate = $112 new value
That is great! Sticking a 1 in front of the percentage is trivial. That is much nicer than our first method of solving the problem that involved two steps.
Remember, × 1.12 is a combination of doing × 1.0 to keep the initial amount around, and doing × 0.12 to find the change.
$5,000 original value × 1.08 rate = $5,400 new value
$200 original value × 1.04 rate = $208 new value
$140 original value × 1.18 rate = $165.20 new value
$750 original value × 1.05 rate = $787.50 new value
For a percent decrease problem we can use the same trick but it looks slightly different. We still add one. But the change we are combining with 1 is negative. So we need to subtract the percentage from 1.
The One Minus Trick
When we multiply by a percentage decrease, we can first subtract the percentage from 1 to keep the original amount around.
$200 × (1 − 0.15) = $200 × 0.85 = $170
$22,500 × (1 − 0.1) = $22,500 × 0.9 = $20,250
Try to explain in your own words the process for increasing a quantity by 10%.
Try to explain in your own words the process for increasing a quantity by 50%.
Is it possible to increase a quantity by 100%? Explain what that would mean.
None yet
Textbook Exercises for the One Plus Trick
This list of recommended odd-numbered textbook problems is designed for a hypothetical student with a "typical" math background. If your math foundation is weak, do even more odd-numbered problems. If your math foundation is strong, do fewer.
Please read the advice on doing homework in the study skills page.
(Our textbook has no exercises for this topic.)
Try these ten exercises on scratch paper. Work in a study group if you can! Notice where your notes need improvement. After you are very happy with your answers, you can use this form to ask me to check your work. Can you get at least 8 out of 10 correct?
1. What is 25% of 228?
2. What is 40% of 750?
3. The price tag (before sales tax) on an item says $100. The sales tax rate is 5%. What is the total price (including tax)?
4. During a sale, a dress decreased in price from $90 to $72. What was the percent of decrease?
5. An investment increases in value from $200 to $216. What is the percent increase?
6. A pinball machine that normally sells for $3,999 is on sale for $3,150. What is the rate of discount?
7. An investment of $3,000 increases in value by 4%. What is the increase?
8. An investment of $4,000 increases in value by 8%. What is the new value?
9. An investment of $5,000 decreases in value by 2.4%. What is the new value?
10. An investment of $6,000 decreases in value by 2%. Then it decreases by another 5%. What is the final value?
Try these exercises on scratch paper. Work in a study group if you can! Notice where your notes need improvement. Check your work when you are done.
Understanding order of operations and terms allows us to smush together numbers using the basic arithmetic operations: +, −, ×, and ÷.
There is a very useful but less well-known fifth arithmetic operation that looks like ∝. It also smushes numbers together. But it is used with rates instead of with plain numbers.
We will call it goeswith because it was invented by the famous yet ficticious mathematician and mad scientist, Lucille Hyperious Goeswith. Other math books and websites might call it the "proportional operator".
To use ∝ we follow a three step algorithm.
Let's look at an example.
First we list the rates. It helps to write them as fractions.

Second we write our goal. For this problem 1 day = _____ dollars. This tells us to start our chain by writing 1 day and keep going until we get to dollars.
Third we make our goeswith chain. The only rate that involves days is 7 hours per day.
1 day ∝ 7 hours ∝ ?
The other rate that involves hours is her average speed. We un-reduce it by multiplying the top and bottom by 7 to get 420 miles per 7 hours. Then we can continue building our goeswith chain.
1 day ∝ 7 hours ∝ 420 miles ∝ ?
The other rate that involves miles is her old car's disappointing mileage. We un-reduce it by multiplying the top and bottom by 21 to get 420 miles per 21 gallons. Then we can continue building our goeswith chain.
1 day ∝ 7 hours ∝ 420 miles ∝ 21 gallons ∝ ?
The other rate that involves gallons is the price of gasoline. We un-reduce it by multiplying the top and bottom by 21 to get 63 dollars per 21 gallons. Then we can continue building our goeswith chain.
1 day ∝ 7 hours ∝ 420 miles ∝ 21 gallons ∝ 63 dollars
The goeswith chain is complete. We now have five items that go with 1 day, including the dollar amount we were looking for.
Let's look at more examples.

6 people ∝ 24 slices ∝ 2 pizzas ∝ $28

1 quart water ∝ 0.25 gallon water ∝ 2 teaspoons permethrin

120 miles ∝ 4 gallons gas ∝ 1⁄3 tank (which is unfortunately more gas than you have left in the tank)

1 year ∝ 365 days ∝ 182.5 packs ∝ $1,095
Goeswith chains can be really useful! The process is pretty foolproof. It tells us when to multiply and when to divide. Yes, we have to write a lot. But if our intuition about when to multiply or divide is not accurate, it is worth writing more to avoid making a mistake.
We recently studied one step measurement conversions. Goeswith chains allow us to solve problems with more than one step.
Unfortunately, goeswith chains are terribly impractical. All of that fraction un-reducing and reducing takes a lot of time. There must be a more efficient way to do this type of problem!
Fortunately, there is a better algorithm! We will study it next. We will stop using goeswith chains.
However, goeswith chains help build an understanding for why this type of math problem smushes rates together two at a time to eventually form a chain that ends with the desired answer. So for the sake of building up a deeper understanding and intuition we do look at goeswith chains now, as a temporary step.
None yet
Textbook Exercises for Goeswith Chains
This list of recommended odd-numbered textbook problems is designed for a hypothetical student with a "typical" math background. If your math foundation is weak, do even more odd-numbered problems. If your math foundation is strong, do fewer.
Please read the advice on doing homework in the study skills page.
(Our textbook has no exercises for this topic.)
Remember that one-step conversions were the wrong tool for some measurement unit conversion problems. We needed a new technique if we did not know a single rate that translated from the old unit to the new unit.
Our new technique is a five-step process called unit analysis. It is a simple and powerful tool. Here are the steps without context, but only for later reference. To first meet the new technique it is best to see it in action in an example.
Unit Analysis
The process of Unit Analysis uses five steps to convert measurement units.
- write the given measurement as a fraction
- write some "empty" rates without numbers
- fill in the numbers for the rates
- multiply
- simplify the fraction answer
Unit analysis is an algorithm whose process is too complicated to be written as a formula.
Here is a simple example of Unit Analysis. We could do this problem much more efficiently as a one-step conversion. But we will use it now merely as a model of the five step process.
Detailed Example of Needless Unit Analysis
How many inches is 3.7 feet?
Our first step is to write the given measurement as a fraction. If it is not already a fraction we put the value over 1.
Our second step is to write some "empty" rates without numbers, multiplying. We do this until each unit we want to get rid of appears in a numerator-and-denominator pair so it will cancel.
Our third step is to fill in the numbers for the rates. To do this we need to memorize or look up the unit conversion rates.
Our fourth step is to multiply. This works just like any other fraction multiplication. Notice how units cancel. We do not normally reduce before multiplying.
Our fifth step is to simplify the fraction answer . Often the denominator is not 1, so we simplify by doing "numerator ÷ denominator" like old unit rate problems.
That was very methodical: if we follow the five steps we have almost no chance of making a mistake.
Some students nickname the unit analysis process "canceling words". Chemists often call it "the Factor-Label method" or "the Unit-Factor method".
The phrase "dimensional analysis" refers to unit analysis along with other techniques involving measurement labels. For example, the left and right sides of an equation must have the same units. Checking if this is true is called dimensional homogeneity, and is a technique of dimensional analysis that is different from unit analysis.
Now for a problem when we actually need to use unit analysis because the unit conversion has more than one step.
Detailed Example of Needing Unit Analysis
How many miles per hour is 200 inches per minute?
Our first step is to write the given measurement as a fraction. If it is not already a fraction we put the value over 1.
Our second step is to write some "empty" rates without numbers, multiplying. We do this until each unit we want to get rid of appears in a numerator-and-denominator pair so it will cancel.
(Be alert! We want distance on top and time on bottom. So we must start that way! Starting with the fraction upside down is our biggest potential danger—besides a careless calculator button error it is the only way to mess up.)
Our third step is to fill in the numbers for the rates. To do this we need to memorize or look up the unit conversion rates.
Our fourth step is to multiply. This works just like any other fraction multiplication. Notice how units cancel. We do not normally reduce before multiplying.
Our fifth step is to simplify the fraction answer . Often the denominator is not 1, so we simplify by doing "numerator ÷ denominator" like old unit rate problems.
To summrize, unit analysis is an important process because it works no matter how many rates are needed to translate from the old units to the new units. The process keeps track of when to multiply and when to divide, so we do not have to keep track in our heads. All we need to do is look up (or memorize) the unit conversion rates and line them up.
Time for more example problems.
9.6 yards⁄1 = 9.6 yards⁄1 × feet⁄yard = 9.6 yards⁄1 × 3 feet⁄1 yard = 28.8 feet⁄1 = 28.8 feet
3 yards⁄1 = 3 yards⁄1 × feet⁄yard × inches⁄feet = 3 yards⁄1 × 3 feet⁄1 yard × 12 inches⁄1 foot = 108 inches⁄1 = 108 inches
1 inch⁄1 = 1 inch⁄1 × feet⁄inches = 1 inch⁄1 × 1 foot⁄12 inches = 1⁄12 foot (or if you prefer a decimal ≈ 0.83 foot)
First change 6 1⁄3 yard into 19⁄3 yard.
19⁄3 yard = 19 yard⁄3 = 19 yard⁄3 × feet⁄yard × inches⁄feet = 19 yards⁄3 × 3 feet⁄1 yard × 12 inches⁄1 foot = 228 inches⁄1 = 228 inches
11 gallons⁄1 = 11 gallons⁄1 × quarts⁄gallons × pints⁄quarts = 11 yards⁄1 × 4 quarts⁄1 gallon × 2 pints⁄1 quart = 88 pints⁄1 = 88 pints
Except for inches to centimeters, the unit conversion rates that move between Standard and SI are rounded. Because they are rounding that happens before the problem is finished they introduce some error. Let's do the same problem in two different ways to see this happen.
3.171 quarts⁄1 = 3.171 quarts⁄1 × liters⁄quarts = 3.171 quarts⁄1 × 1 liters⁄1.057 quarts = 3 liters⁄1 = 3 liters
3.171 quarts⁄1 = 3.171 quarts⁄1 × liters⁄quarts = 3.171 quarts⁄1 × 0.946 liters⁄1 quarts = 2.999766 liters⁄1 ≈ 3 liters
Is the answer slightly less than three liters or not? It is actually slightly more! But because our original number had quite a few decimal places the unit conversion rates we used did not have enough decimal places to produce answers with enough accuracy.
If your original numbers have many decimal places (thus asking your answers to also have many decimal places) you will need unit conversion rates with lots of decimal places.
Please watch this YouTube video of a Scotch Yoke by Engine On.

Notice how the device changes rotational motion (the wheel spins) to linear motion (the horizontal rod slides back and forth).
Machines have all sorts of uses for changing between rotational and linear motion. So mathematicians have named a few ratios involved in this process.
Imagine we have a circle of radius 1, nicknamed the unit circle. Our knob on the Scotch Yoke machine has rotated to a spot in the upper right quadrant. We name three measurements.
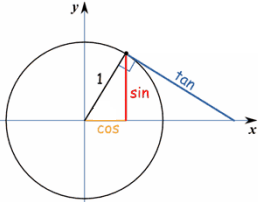
The knob's vertical height is named the sine and abbreviated as sin.
The knob's horizontal distance is named the cosine and abbreviated as cos.
If the knob was pulling a string, and the angle between the circle's radius and the string was a 90° right angle, that distance is named the tangent and abbreviated as tan.
If the knob continued rotating until it was in the upper left quadrant, the height (sin) would still be positive, for the knob is then above the circle's center. But now the horizontal distance (cos) would be negative because the knob is left of the circle's center.
If the knob continued rotating until it was in the lower left quadrant, both the height (sin) and the horizontal distance (cos) would be negative. The knob is then below and left of the circle's center.
If the knob continued rotating until it was in the lower right quadrant, the height (sin) would be negative, for the knob is then below the circle's center. But the horizontal distance (cos) would be positive, because the knob is then right of the circle's center.
As a final step, if we scale up the size of the circle (perhaps doubling its radius) then we need to divide the sine, cosine, and tangent by the circle's radius (perhaps ÷ 2) to get back to the drawn unit circle situation. In other words, it helps to think about these three trigonometry amounts not as measurements but as ratios!
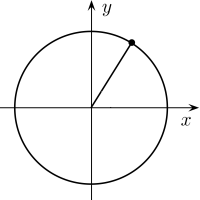
height 1.8 ÷ radius 2 = 0.9
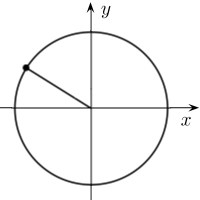
horizontal distance negative 4.6 ÷ radius 5 = − 0.92

height negative 10 ÷ radius 12 ≈ − 0.83
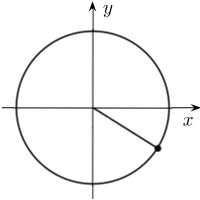
horizontal distance 87 ÷ radius 100 ≈ − 0.87
There is a lot of interesting stuff about these three trigonometry measurements. For example, the tangent is also the height that a laser gun would shoot when aiming at a wall placed at the unit circle's far right edge.
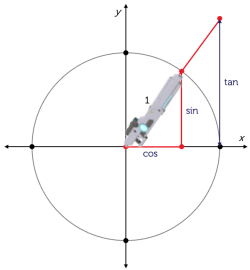
As a third thing, the tangent is also the ratio of the sin to the cosine!
But proving that the tangent is both of those other things takes slightly advanced math, and moves away from the initial and most helpful mental image of the Scotch Yoke changing between rotational and linear motion.
KetzBook
Unit Conversion the Easy Way (Dimensional Analysis)
Mathispower4u
Find the Number of Meters Traveled in 3 seconds Given Kilometers Per Hour
Bittinger Chapter Tests, 11th Edition
Chapter 8 Test, Problem 1: How many inches is 4 feet?
Chapter 8 Test, Problem 2: How many feet is 4 inches?
Chapter 8 Test, Problem 5: How many meters is 200 yards?
Chapter 8 Test, Problem 6: How many miles is 2,400 kilometers?
Chapter 8 Test, Problem 11: How many ounces is 4 pounds?
Chapter 8 Test, Problem 12: How many pounds is 4.11 tons?
Chapter 8 Test, Problem 16: How many minutes is 5 hours?
Chapter 8 Test, Problem 17: How many hours is 15 days?
Chapter 8 Test, Problem 18: How many quarts is 64 pints?
Chapter 8 Test, Problem 19: How many ounces is 10 gallons?
Chapter 8 Test, Problem 20: How many ounces is 5 cups?
Textbook Exercises for Unit Analysis
This list of recommended odd-numbered textbook problems is designed for a hypothetical student with a "typical" math background. If your math foundation is weak, do even more odd-numbered problems. If your math foundation is strong, do fewer.
Please read the advice on doing homework in the study skills page.
Section 7.1 (Page 371) # 13, 41, 43, 45, 47, 49, 51
Section 7.2 (Page 382) # 55, 59, 65
Section 7.3 (Page 388) # 35, 39, 41
Try these ten exercises on scratch paper. Work in a study group if you can! Notice where your notes need improvement. After you are very happy with your answers, you can use this form to ask me to check your work. Can you get at least 8 out of 10 correct?
1. A retirement annuity will pay the purchaser $15 each month for every $5,000 purchased. What will be the monthly payout if someone buys $65,000 of that annuity?
2. A retirement annuity will pay the purchaser $15 each month for every $5,000 purchased. What will be the annual payout if someone buys $125,000 of that annuity?
3. It is estimated that a driver takes, on average, 1.5 seconds from seeing an obstacle to reacting by applying the brake or swerving. How far (in feet) will a car driving at 85 miles per hour travel before the driver reacts to an obstacle?
4. During the past month a boring stock has a price-to-earnings ratio of 11-to-1. Today that company's remarkable new innovation was featured in the news, and the stock price jumped from $44 to $90. What is now the company's expected annual earnings per share?
5. A college student works as an independent tutor, and charges $20 for every hour she works. If she tutors for 12 hours each week during all nine months of the local school year, how much will she earn from tutoring? Estimate by pretending each month has four weeks.
The next five problems are copies of those solved above using goeswith chains, but with some numbers changed. Now you can see for yourself how much easier thes are when using unit analysis!
6. Lucy drove from Portland to Denver. On average, she drove 6 hours per day, at 65 miles per hour. Gasoline cost 3 dollars per gallon. Her old car gets 18 miles per gallon of gasoline. How much did she spend each day on gasoline?
7. Forty students order pizza for a school club event. Each student will eat three slices. A pizza has 8 slices and costs $9. How much will they spend?
8. A pest control worker needs to add permethrin to 2 gallons of water. This application needs 3 teaspoons of permethrin per pint of water. How much permethrin should he use? (Hints: 3 teaspoons = 1 tablespoon, and 1 cup = 16 tablespoons)
9. Your car has a 10 gallon gasoline tank and has a mileage of 24 miles per gallon. When driving cross-country you are at a quarter tank of gasoline remaining and see a sign that says "Next gas 50 miles". Will you make it?
10. Luke smokes three-quarters a pack of cigarettes each day. Each pack costs $5.60. How much will he spend per year on cigarettes?
The probability of a situation happening is the ratio of desirable outcomes to total outcomes.
Because of tradition, probabilities are usually written as unreduced fractions or changed into percent format.
Problems that involve probability almost always involve a bunch of counting. Usually there are no convenient formulas to help us. We need to make lists or tables to count the outcomes.
A classic example of probability is rolling two dice and adding their values.
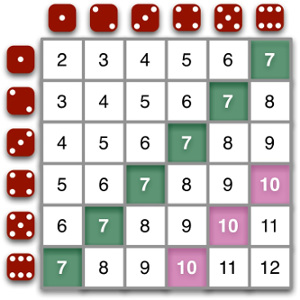
Looking at the green boxes on the chart, we see that six out of thirty-six possibilities have a sum of seven.
So the probability is 6⁄36
We could change this fraction into percent format. 6 ÷ 36 ≈ 0.167 = 16.7%
We would not usually reduce this to 1⁄6 because that would imply a simpler situation with only six outcomes, of which one outcome is considered desirable.
Looking at the green boxes on the chart, we see that three out of thirty-six possibilities have a sum of ten.
So the probability is 3⁄36
We could change this fraction into percent format. 3 ÷ 36 ≈ 0.083 = 8.3%
We would not usually reduce this to 1⁄12 because that would imply a simpler situation with only twelve outcomes, of which one outcome is considered desirable.
Imagine there is a gumball machine with equal amounts of three colors of gumballs: red, green, and blue. The table below shows all twenty-seven possibilities for getting three gumballs.

Nineteen of the twenty-seven possibilities have at least one blue gumball.
So the probability is 19⁄27
We could change this fraction into percent format. 19 ÷ 27 ≈ 0.7 = 70%
We would not usually reduce this if we could, because that would imply a simpler situation.
Notice that the probability of a certain event is 1 (or 100%).
Notice that the probability of an impossible event is 0 (or 0%).
Notice that the probability of all events must be between 0 and 1 (so between 0% and 100%).
The odds of a situation happening is the ratio of desirable outcomes to undesirable outcomes.
Because of tradition, odds are usually written as reduced fractions. They are not changed into percent format.
Looking at the green boxes on the chart, we see that six out of thirty-six possibilities have a sum of seven, and thirty do not.
So the odds are 6 to 30, which inormally would be written reduced to 1 to 5.
Looking at the pink boxes on the chart, we see that three out of thirty-six possibilities have a sum of ten, and thirty-three do not.
So the odds are 3 to 33, which inormally would be written reduced to 1 to 11.
Looking at the gumball chart, we see that 19 out of twenty-seven possibilities have at least one blue, and 8 do not.
So the odds are 19 to 8, which inormally would be written reduced to 2 to 1.
In this class we will always write odds using the word "to". For example, 1 to 5. Other math books, websites, and real-life contexts might use a colon instead, and write the same ratio 1 : 5.
Notice that the odds of a certain event is 1 to 0.
Notice that the odds of an impossible event is 0 to 1.
Notice that the odds of all events could have any two numbers. A lottery can have odds of "a million to one".
Math Antics
OCLPhase2
There are a few important probability issues more complicated than simply counting the probability or odds of an outcome happening. To discuss them clearly we must unfortunately introduce more jargon.
The individual and specific ways a situation can happen are called outcomes.
A collection of outcomes that we group together as a single desired result is called an event.
So in our table of rolling two dice and adding their values the six green squares (where we colored a sum of seven) were six different outcomes grouped together as one event.
We could list these six different outcomes if we really wanted: roll 1 and 6, roll 2 and 5, roll 3 and 4, roll 4 and 3, roll 5 and 2, roll 6 and 1.
We cannot list the event, we can only name it: "the sum is seven".
Some events contain a single outcome. In the table above, the event "the sum is 12" only happens with the outcome of rolling two 6s. An event that only contains one outcome is named a simple event.
Many events contain several outcomes. In the table above, the event "the sum is 10 or more" contains six outcomes (the three shaded pink events with a sum of 10 as well as the three events below and to the right of those with higher sums). Those are called compound events.
Notice that in the table above, the event "the sum is 7" is a compound event. There are six shaded green events within this outcome.
The complete group of all events is named the sample space.
When we roll two dice and add their values, the sample space contains eleven events: "the sum is 2", "the sum is 3", and so on all the way up through "the sum is 12". In the table those events in the sample space are the eleven diagonals going southwest-to-northeast.

Notice that a real-life situation can have many different sample spaces, depending upon which questions are asked. When rolling two dice, we could ask lots of things about the sum.
Notice that events can overlap. When rolling two dice, we could ask, "What is the chance of rolling 5 or more?" and also ask, "What is the chance of rolling 9 or more?"
Many real-life problems involve a sample spaces that is completely covered by two non-overlapping events. Either we roll a 7 or we do not. Either we roll an odd number or we do not. We call those two complete yet exclusive options complementary events.
Unfortunately, very similar jargon is used when two events have no predictive effect on each other. For example, when we roll two dice they do not effect each other's results. (In contrast, the weather in two nearby cities will have a predictive effect. Rain in one will mean a higher chance of rain in the other.) Events that contain no predictive information about the other are called independent events.
It is very common for students who are first studying probability to confuse complementary events and independent events. Perhaps the following example will help you remember.
Complementary vs. Independent Events

Whenever Slightly Sleazy Sam goes to a dance he randomly tells half the women he dances with that they have pretty eyes.
The events "he says I have pretty eyes" and "he does not say that" are complementary. (Although neither is genuinely complimentary).
The events "he says I have pretty eyes" and "he says my best friend has pretty eyes" are independent. (He does not realize you two are friends).
When events are not independent we can talk about how much they are conditional on each other: how much probability of one event changes if we know (either by measuring or assuming) that the other did indeed happen.
An example of coniditional events involve home pregnancy tests, which very seldom give false positives but commonly give false negatives. The table below summarizes a study in which 900 women were asked to use a home pregnancy test, and then also used a completely reliable blood test at a doctor's office to double-check.
| Pregnant | Not Pregnant | |
|---|---|---|
| Positive Home Test | 322 | 3 false positive |
| Negative Home Test | 277 false negative | 298 |
There were 322 people who both were pregnant and had a positive home test. There were 900 people total.
So the probability would be 322 ÷ 900 ≈ 0.36 = 36%.
Unsurprisingly, about twice as many women who suspected they might be pregnant volunteered for this study. That skewed the totals to a 66% vs. 33% for pregnant or not. Among those who were pregnant, the test correctly identified more than half, resulting in our answer of 36%.
There were 322 people who both were pregnant and had a positive home test. There were 325 people with a positive home test.
So the probability would be 322 ÷ 327 ≈ 0.99 = 99%.
The home test is very reliable when it is positive.
There were 277 people who both were pregnant and had a negative home test. There were 575 people with a positive home test.
So the probability would be 277 ÷ 575 ≈ 0.99 = 48%.
The home test is not very reliable when it is negative. There is a 48% chance the result is a false negative!
Some events will only happen if another event happens. This most extreme type of conditional events is called contingent events.
It is easy to brainstorm contingent events. I only eat birthday cake if I am at a birthday party. I only climb trees when I am outside.
Most dice games ask the players to pick up all the dice with each roll. Situations like this are called outcomes with replacement. It does not matter what either die rolled previously, because it will be picked up and re-randomized for the next roll.
A Ten Card Puzzle: With Replacement
Someone makes a small deck of cards with the ace through ten of hearts.

The person shuffles and reveals the top card. Then the person puts that card back, re-shuffles, and again reveals the top card. What is the chance both revealed cards are odd numbers? (Ace is considered an odd number.)

Our outcomes are pairs of cards that can contain duplicates. We can list them: two aces, ace and two, two and ace, and so on...
Our events are pairs of odd/even. When we make a table of all four possible events we have described the sample space.
| even then even | even then odd | odd then even | odd then odd |
All four events are equally likely.
| even then even 1⁄4 |
even then odd 1⁄4 |
odd then even 1⁄4 |
odd then odd 1⁄4 |
The right-most table entry tells us the probability that both revealed cards are odd is 1⁄4 or 25%.
Most card games games, however, ask the players to leave certain cards face up after shuffling and revealing the top card. Situations like this are called outcomes without replacement. It does matter what the first revealed card is, because we then know the rest of the deck does not contain that card.
A Ten Card Puzzle: Without Replacement
Someone makes a small deck of cards with the ace through ten of hearts.
The person shuffles and reveals the top card. But the person does not put that card back! If they drew the ace, for example, the deck now has only nine cards.

The person then reveals the next top card. What is the chance both revealed cards are odd numbers? (Ace is considered an odd number.)
Our outcomes are pairs of cards that cannot contain duplicates. We can list them: ace and two, two and ace, and so on...
Our events are pairs of odd/even. When we make a table of all four possible events we have described the overall sample space.
| even then even | even then odd | odd then even | odd then odd |
Actually, it will be more helpful to write each entry in the table in reverse chronological order. We will rephrase each event to first describe what happens last in time.
| even after even | odd after even | even after odd | odd after odd |
All four events are not equally likely.
Consider the event named "odd after even". The probability that the first card is even is 5⁄10. But then the deck has only nine cards, of which five are still odd (since this event requires first removing an even card).

So the probability that the second card is odd is 5⁄9.
We must ask ourselves, "What is 5⁄9 of the chance the first card is even?"
In other words, that question becomes "What is 5⁄9 of 5⁄10?"
The word of signifies multiplication, as it usually does. So that event's overall probability is 25⁄90.
The other three events can be found similarly.
| even after even 4⁄9 × 5⁄10 = 20⁄90 |
odd after even 5⁄9 × 5⁄10 = 25⁄90 |
even after odd 5⁄9 × 5⁄10 = 25⁄90 |
odd after odd 4⁄9 × 5⁄10 = 20⁄90 |
Now we see why it helps to describe the table entries in reverse chronological order. It allows us to more naturally use the English language to ask "What is a more recent chance that modifies a previous chance?"
The right-most table entry tells us the probability that both revealed cards are odd is 20⁄90 or about 22%.
Changing the rules to make the situation without replacement reduced the probability of our desired outcome by 3%!
There are two common ways to measure the size of a shape: perimeter and area.
Perimeter
The perimeter of a shape is the distance around its edges.
Area
The area of a shape is how much room the shape's surface takes up.
We'll start by talking about perimeter.
Let's explore the perimeter of polygons.
Polygon
Polygons are closed shapes whose edges are straight lines.
Here are a bunch of polygons: squares, rectangles, triangles, parallelograms, and trapezoids.

Perimeter is the distance around a shape. There is nothing more complicated to say, since all polygon perimeter problems are simply adding up the lengths of sides.

Finding a perimeter is easy. Just mark a corner (so you don't carelessly forget an edge) and begin adding.
For the first 3 inches + 4 inches + 5 inches = 14 inches
For the second it might help to label the sides that start without labels. 3 + 6.1 + 3 + 6.1 = 18.2 inches

There are only two possible ways to be tricky.
The first way to be tricky with perimeter is demonstrated with this problem:
We need to first change the sides labeled with 2.5 feet so they are labeled with 30 inches.
Then 30 inches + 20 inches + 30 inches + 20 inches = 100 inches
The trickiness comes from hiding a measurement unit conversion problem inside the perimeter problem.
The second way to be tricky is to ask a complicated question while being obtuse about providing all the required information, like this problem:
Oops. That is not a math problem. Let's try again.

This problem is a great excuse to introduce a six-step problem solving process.
Step one is Determine what you are looking for. Read the problem two or three times so you understand it and notice all the details. Write down (or pretend to write) in an English sentence what you are looking for. Don't wander off track and forget what you are looking for.
Consider our example problem. We are looking for a number of miles. We need to add a bunch of numbers.
Step two is Draw pictures. Draw a picture or diagram of the situation. Then label things in the picture or diagram! Your visualization will not be much help without labels.
Consider our example problem. The diagram is already provided. Hooray!
But two sides are not labeled. We can use subtraction to find the missing lengths.

For the top we added ½ mile + 1 mile = 1 ½ mile
For the far left we subtracted ¾ mile − ½ mile = ¼ mile
Step three is Name Things. Write (or pretend to write) English sentences to give a one letter name to each quantity. Be aware of when two quantities are related to each other and can be expressed using the same letter. Check that each piece of information you are given is really relevant to the problem.
Consider our example problem. We are not told where on the route he starts (and stops). But that does not matter. We should just pick a corner as our "start" and label it. Let's use the top left corner.
Step four is Make equations. Express each relationship you know as an equation. Write (or pretend to write) an English sentence explaining each equation you write.
Consider our example problem. The sum is 1 ½ mile + ¾ mile + 1 mile + ½ mile + ½ mile + ¼ mile
Step five is Solve the equations.
Consider our example problem. The two ½'s add to 1. The ¼ and ¾ also add to 1. The total is 1 mile + 1 mile + 1 mile + 1 ½ miles = 4 ½ miles
Step six is Check your answer. Check that your answer is a reasonable amount. Make sure that your final answer is in units that make sense.
Consider our example problem. An answer of four ½ miles seems reasonable.
What can you do if you get stuck? Here are five ways to try to get unstuck.
For most people, the hardest part of a word problem is drawing the picture, naming the amounts, and especially setting up the equation.
Also remember which English words and phrases correspond with which arithmetic operations. Addition is usually "sum", "total", "increased by", or "more than". Subtraction is usually "difference", "how much more", "decreased by", or "less than". Multiplication is usually "of" or "times". Division usually lacks a phrase but is about finding equal portions.

If sorting word problems (without being asked to solve them) sounds interesting, there is a playground about that!
Finding the area of a rectangle is easy. The formula Area = length × width is well known to most students.

Squares are just the same.
Take three paper rectangles to use while we figure out how other area formulas relate to the area for rectangles.
With a partner, take one of your paper rectangles and invent a way to use it to explain how to measure the area this triangle. Imagine that all you know is how to find the area of a rectangle.

One fold will make this kind of triangle out of a rectangle.

We can see the triangle uses up half of the rectangle. So its area is half of the rectangle's area.
The previous triangle had one side straight up and down. How about this other triangle with two slanted sides?

Two folds will make this kind of triangle out of a rectangle.

Which still is half of the rectangle, as we can see by moving the small piece over.

So for any triangles—whether they have a vertical side or not—we can see the triangle uses up half of the rectangle. Any triangle's area is half of the area of the rectangle that snugly contains it.
For historical reasons we normally do not write Area = 1⁄2 × length × width for the area of a triangle. Instead of "length" and "width" we call those measuremets "base" and "height".
Why does Area = 1⁄2 × base × height make people happier? No idea.
Students who prefer decimals to fractions will use the variation Area = base × height ÷ 2.
Notice that finding the area of a triangle requires its height, not diagonal edge lengths.
With a partner, take another of your paper rectangles and invent a way to use it to explain how to measure the area this parallelogram. As before, imagine that all you know is how to find the area of a rectangle.


We can make a rectangle out of a parallelogram by cutting off a triangular shape and sliding it over.

We could reverse this to make a paralellogram from a rectangle.
The area of a paralellogram is thus the same as the area of the rectangle.
Notice that finding the area of a parallelogram requires its height, not diagonal edge length.
One last time, with a partner, take another of your paper rectangles and invent a way to use it to explain how to measure the area this trapezoid. As before, imagine that all you know is how to find the area of a rectangle.
Sure, we could cut it apart into two triangles and a rectangle but that is too much work.


The area of a trapezoid is thus half of the area of a bigger parallelogram. This bigger parallelogram has a base whose length is equal to top + bottom for the original trapezoid.
We can write Area = (top + bottom) × height ÷ 2.
Notice that finding the area of a trapezoid requires both horizontal edges and its height, but not either diagonal edge length.
The formula for the area of a trapezoid can instead be written using an average. It looks like "average the horizontal sides, then multiply by the height" if we rewrite it as Area = (top + bottom) ÷ 2 × height.
As a special challenge, try proving that the area of a trapezoid equals its perimeter times one-quarter its height. (If you need a hint, click here.)
We just invented a bunch of algorithms! These polygon area formulas should make sense to you now.
If you want to double-check your understanding before the final exam, you can use this summary page. What is the area of each shape? How could you prove it to a first-grader using scissors and perhaps a crayon?

Mathispower4u
Bittinger Chapter Tests, 11th Edition
Chapter 9 Test, Problem 1: A rectangle has length 9.4 cm and width 7.01 cm. Find its perimeter and area.
Chapter 9 Test, Problem 2: A square has sides of length 4 7⁄8 inches. Find its perimeter and area.
Chapter 9 Test, Problem 3: A parallelogram has base 10 cm and height 2.5 cm. Find its area.
Chapter 9 Test, Problem 4: A triangle has base 8 meters and height 3 meters. Find its area.
Chapter 9 Test, Problem 5: A trapezoid has a bottom 8 feet long, top 4 feet long, and height of 3 feet. Find its area.
Chapter 9 Test, Problem 36: A rectangle has length 8 feet and width 3 inches. Find its area in square feet.
Chapter 9 Test, Problem 37: A triangle has base 5 yards and height 3 inches. Find its area in square feet.
Textbook Exercises for Polygon Perimeter and Area
This list of recommended odd-numbered textbook problems is designed for a hypothetical student with a "typical" math background. If your math foundation is weak, do even more odd-numbered problems. If your math foundation is strong, do fewer.
Please read the advice on doing homework in the study skills page.
Section 1.2 (Page 23) # 85, 89, 91
Section 1.5 (Page 60) # 105, 107, 109, 113
Section 2.4 (Page 129) # 57, 59, 61
Section 8.1 (Page 422) # 1, 3, 5, 7, 9, 11, 13, 35, 37, 39
Section 8.2 (Page 430) # 1, 3, 5, 7, 17, 19, 21
For many students, finding the area of a rectangle as length × width makes a lot of sense when they see a drawing.
This makes a link in our brain. Multiplying two things can be pictured in our minds as a rectangle's area.
We can use drawings of a rectangle's area to help explain why different examples of multiplication make sense.
Let's start with the traditional multiplication algorithm.
First we use the traditional multiplication algorithm to find 31 × 25 without a calculator.

In our answer each of the four multiplication steps was given its own color. You can see why while looking at the rectangle version of this multiplication.

That rectangle diagram does not include the final answer.
We still need to add up the numbers in its four parts. 600 + 20 + 150 + 5 = 775.
Notice how the in the traditional multiplication algorithm we added those same four numbers but in a different way.
Now it can be your turn with another multiplication problem.


Play around with this more, on your own.
What happens if one number has three digits?
How special is the ghostly gray zero?
We saw earlier how to use place value to think about mixed number subtraction. Can you draw a rectangle diagram for 4 ¼ × 8 ½ = 36 ⅛?
When using a rectangle to help picture 31 × 25 we needed to realize that 31 = 30 + 1 to label one side as two lengths, and 25 = 20 + 5 to label the other side as another two lengths.
Word problems that similarly involve both addition and multiplication can sometimes be written as rectangle diagrams.

Explaining how rectangle diagrams work with algebra would involve more algebra than you might have already learned.
But just in case you have already seen enough algebra to understand, here is one final rectangle diagram.

Maybe that makes you happy?
If that type of algebra is new to you, but makes sense so far, you can search online for a video about the "distributive property".
Time to talk about about circles.
Consider your arm. How many "arm heights" does it take to go around your arm?


How about your head? How many "head widths" does it take to go around your head?

Our answers about measuring our body parts will vary, because arms and heads are not very circular.
If we were measuring actual circles, the answer to the question "How many circle widths does it take to go around the outside?" would be a number bigger than 3 but less than 4.
We need some more careful language.
Circle Width
The width of a circle, going through the center, is its diameter.
Circle Perimeter
The perimeter of a circle is called its circumference.
(Don't ask me why. "Perimeter" was already a perfectly usable word for this.)
So we can reword what we said. If we were measuring actual circles, the answer to the question "How many diameters does it take to go around the circumference?" would be a number bigger than 3 but less than 4.
If we were to write this as formulas, the answer is between C = 3 × d and C = 4 × d.
What number between 3 and 4 is the correct coefficient?
This answer for actual circles is roughly 3.14159 but its decimal digits keep on going forever without any repeating pattern. We call this number π (also written as "pi").
Thus we can look really fancy and professional and write a formula, using either words or just letters.
Circumference = π × diameter
C = π × d
But all this formula really says is "the distance around a circle is a bit more than three times its width".
This animation from Wikipedia shows what is happening nicely:

Consider this small square, of area A = r2.

If we make four of them, the area is then A = 4 × r2.

Now we ask a second question about circles: how large a circle can we fit into the big square of area 4 × r2?

That little line going from the circle's center to its edge (half a diameter) is really useful. Let's give it a name.
Radius
Half the diameter is the radius.
It looks like the circle covers more than 3 of the little squares, but not all 4.
So the area of the circle is between A = 3 × r2 and A = 4 × r2.
What number between 3 and 4 is the correct coefficient?
The answer is the same number as the answer to the circumference question: π!
Area = π × radius2
A = π × r2
Again, this looks fancy and professional but really only says "a circle covers a bit more than three squares with side length equal to the circle's radius".
Wonderful! If π was not the answer to both the circumference question and the area question then we would need two buttons on our calculator instead of merely one.
Are the circle formulas algorithms? They can be. Math problems can give you a radius or diameter and ask you to treat the formulas as a process to follow to calculate the circumference or area. But keep in mind that these formulas are also plain descriptions of how circles behave. A bit more than three diameters are required to cover the circumference. A circle covers a bit more than three squares whose side length is the radius.
Naturally, rounding π before the end of a problem will cause incorrect answers. To develop optimal math habits, you should always use the calculator key for π so that you do not round in the middle of the problem. However, some textbooks or websites use a rounded version of π (either 3.14 or 22⁄7). This means your answers will not quite match because yours are more accurate.
A final note of warning: some students learn the circumference formula as C = π × 2 × r. This makes it look a lot like the area formula: both have a π, an r, and a 2. Don't get mixed up! The easiest way to avoid a careless mistake is to use the circumference formula with a diameter.
Circumference = π × diameter = π × 4 inches ≈ 12.6 inches
Area = π × radius2 = π × 22 square inches ≈ 12.6 square inches

Circumference = π × diameter = π × 2 inches ≈ 6.3 inches
Area = π × radius2 = π × 12 square inches ≈ 3.1 square inches

Circumference = π × diameter = π × ½ inches ≈ 1.57 inches
Area = π × radius2 = π × ½2 square inches ≈ 0.78 square inches

First we break apart the shape into a half-circle and a rectangle.
For the perimeter, add halfway around the circle with three sides of the rectangle.
For the area, add half of the circle's area with all of the rectangle.
The perimeter is about 14.6 inches.
The answer is about 16.9 inches.

Bittinger Chapter Tests, 11th Edition
Chapter 9 Test, Problem 6: A circle has a radius of one-eighth of an inch. What is its diameter?
Chapter 9 Test, Problem 7: A circle has a diameter of 18 centimeters. What is its radius?
Textbook Exercises for Circle Circumference and Area
This list of recommended odd-numbered textbook problems is designed for a hypothetical student with a "typical" math background. If your math foundation is weak, do even more odd-numbered problems. If your math foundation is strong, do fewer.
Please read the advice on doing homework in the study skills page.
Section 8.1 (Page 422) # 15, 17, 21, 23
Section 8.2 (Page 529) # 13, 15, 17, 23, 31, 37
Try these ten exercises on scratch paper. Work in a study group if you can! Notice where your notes need improvement. After you are very happy with your answers, you can use this form to ask me to check your work. Can you get at least 8 out of 10 correct?
1. Two years is how many minutes?
2. A football field is 4,844 cm wide. What is that width in yards? (1 meter ≈ 1.09361 yards)
3. A plane flying 6,500 feet per minute is going about how many miles per hour?
4. Including the end zones, a football field is 360 feet long and 160 feet wide. If you run three laps around a football field, about what percentage of a mile do you run?
5. You want to buy Sculpey III modeling clay online. At amazon.com it costs $7.29 for 8 ounces. At amazon.co.uk it costs £2.20 for 57 grams. (1 ounce ≈ 28.35 grams. If £1 ≈ $1.31), which is a better buy?
6. A triangle has base 4 m and height 3.5 m. What is the area?
7. Most billiard tables are twice as long as they are wide. What is the perimeter of a billiard table that measures 4.5 feet by 9 feet?
8. A parallelogram has base 2.3 cm and height 3.5 cm. What is the area?
9. A trapezoid has base 25 cm, top 16 cm, and height 35 cm. What is the area?
10. The standard backyard trampoline has a diameter of 14 feet. What is its area?
Try these exercises on scratch paper. Work in a study group if you can! Notice where your notes need improvement. Check your work when you are done.
When we stretch a shape by a certain amount, we call that a "scale factor". For now, just go with the flow of that idea. Later we will learn the details about using scale factors.
We can stretch a circle horizontally, or vertically, or both.

It is not surprising that making one direction five times as big would also make the area five times as big. Or that making the other direction three times as big would also make the area three times as big.
Both can happen at the same time. This gives us a rough draft for the area formula for an ellipse.
A = π × radius2 × horizontal scale factor × vertical scale factor
However, we can make this rough draft simpler. What if the circle we started with had a radius of 1? Then the radius2 part of the formula just becomes × 1 and can be ignored.

A = π × horizontal height × vertical width
How about the distance around the outside of an ellipse? Should we call that a perimeter or a circumference?
Actually, we try to never talk about distance around the outside of an ellipse. It requires calculus to measure. You can read more on Wikipedia if you care.
Note that this is not really so surprising. The perimeter of any closed curve shape other than a circle is very complicated! Circles are the simplest closed curved shape, with only one scale factor (the diameter) needed to say how big they are. Remember that π is the name we gave for how a circle's circumference compares to its diameter. For any other closed curve shape we cannot simply name how the perimeter compares to other things.
I see that the life of this place is always emerging beyond expectation or prediction or typicality, that it is unique, given to the world minute by minute, only once, never to be repeated. That this is when I see that this life is a miracle, absolutely worth having.
- Wendell BerryThat is the crowning unlikelihood, the thermodynamic miracle...Come, dry your eyes, for you are life, rarer than a quark and unpredictable beyond the dreams of Heisenberg; the clay in which the forces that shape all things leave their fingerprints most clearly.
- Watchmen, Chapter IX

Pattern blocks come in several shapes.
The green triangle is smallest.
Two green triangles make a blue diamond. (If you want, be especially mathy and call it a rhombus.)
Three green triangles make a red trapezoid.
Six green triangles make a yellow hexagon.
Pattern blocks can be used for many kinds of math activities.
If we call a green triangle "one", then we can teach multiplication. We can physically model 2 × 6 = 12 by asking how many green triangles are needed to cover two yellow hexagons.
If we call a yellow hexagon "one", then we can teach fractions. We can physically model 12 × 1⁄3 = 4 by asking how many yellow hexagons are covered by twelve blue diamonds.
But we are going to use pattern blocks while being a bit more philosophical. Instead of explaining arithmetic, we want to investigate language.
My scale tells me that a green triangle pattern block weighs 1.5 grams.

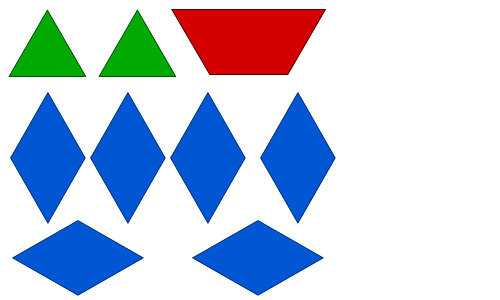
Hm. What do we mean by typical? Discuss this with your classmates and develop an answer that you are prepared to defend before the class, using the pattern blocks as props if that helps.
There is no right answer. The definition of the word typical is somewhat slightly vague language issue.
However, people's answers tend to focus on three slightly different ideas:
Some people focus on what appears the most often.
Those people pick the blue block, because we have six of those. So a "typical" block would be blue, and would weigh 1.5 grams × 2 = 3 grams.
Some people throw out items that only appear once or twice. Those items do not appear often enough to be considered representative of the group. They focus on what appears the most representative.
Those people also pick the blue block. But not because of how many blue blocks there were. Instead, because they threw out the green and red blocks. Again a "typical" block would be blue, and would weigh 1.5 grams × 2 = 3 grams.
Some people feel a need for either inclusiveness or precision, and take an average. They sum the values and then divide by how many values there were.
Those people would not pick a kind of block. Instead they do more calculation. The total weight is (1.5 × 2 greens) + (3 × 6 blues) + (4.5 × 1 red) = 25.5 total grams. Then dividing by how many blocks there gives an average weight of 25.5 total grams ÷ 9 blocks ≈ 2.8 grams.
Note that the first and second kind of people would say a blue block is typical. But the third kind of people would say that a blue block is a bit more than typical. Does that matter?

The people that focus on most often would still pick the blue block, because we have six of those, and still say 3 grams.
The people that focus on most representative would still pick the blue block, because we have one or two of the other kinds, and still say 3 grams.
The people that calculate the average would now get a total weight of (1.5 × 2 greens) + (3 × 6 blues) + (4.5 × 1 red) + (9 × 2 yellows) = 43.5 total grams, which would change the average weight to 43.5 total grams ÷ 11 blocks ≈ 4 grams.
There is no right answer. We can disagree about definition of the word typical.
It was perhaps Benjamin Disraeli who first said, "There are three kinds of lies: lies, damned lies, and statistics." That quotation is often said to imply that statistics can be purposefully used to mislead.
But the point to our investigation of the word typical is how people can get different answers without any purposeful deceit. Statistics can be naturally uncertain because language is naturally ambiguous.
Fortunately, mathematicians have tools to remove the uncertainly and ambiguity.
Certainly we want some math terms to help us recognize when someone might be misleading us with statistics.
But more important is to develop an intuition about what happens when real life is not as typical as the formulas expect.
The formulas and guidelines are accurate and reliable! But the ones about home ownership assume a typical home, and the ones about saving for retirement assume a typical life progression from younger (with little income) to older (with more income). In reality, homes and lives are all unique, and future home prices and salaries are guesses. We plug fuzzy numbers into reliable formulas.
Good news! Math can still help us, even when we do not fully trust the numbers. Let's see how.
The average you we used above with pattern blocks is formally called the mean.
The Mean
To find the mean of a group of numbers, first add up all numbers and then divide by how many numbers are in the group.
When people say "average" it should be safe to assume they are talking about the mean, unless they say otherwise.
The mean is the most commonly used average because in many everyday situations the mean does what we want. It looks at a set of numbers and provides an answer close to most often but more accurate, and close to most representative but more inclusive.

First we add up all the numbers.
34 + 36 + 36 + 36 + 37 + 37 + 38 + 39 + 40 + 40 + 41 = 453 pounds
Then we divide that total by 12, because there are 12 students.
453 pounds ÷ 12 = 37.75 ≈ 38 pounds
Notice why the answer to the previous problem feels right. It is close to what number appears most often. Also, looking at the histogram it seems most representative.
That last point is important. The mean is where a histogram balances if it were a measuring scale.

First we add up all the numbers.
2 + 2 + 6 + 10 = 20
Then we divide that total by 4, because there are 4 blocks.
20 ÷ 4 = 5
(We can also see this illustration in a different way. The two blocks on the left side are each 3 spots from the center, for a total left hand weight of 6. The two blocks on the right side are 1 and 5 spots from the center, for a total right hand weight of 6. The balance spot is accurate because the left and right hand weights both total six.)
When we want to talk about averages, not all groups of numbers are equally friendly. Here are four histograms that show test scores for a History class.
 |
 |
 |
 |
The class shown in histogram A has two subgroups of students. About half the students did poorly on the test, and half did well. We foolishly could calculate the mean of this group of numbers but doing so would be inappropriate and misleading. There are really two subgroups, each with their own typicality.
The class shown in histogram B has two subgroups of students, and test scores are even more extreme. In this class the students tended to do really terrible or really amazing. Very few were in between. As before, we foolishly could calculate the mean of this group of numbers but doing so would be inappropriate and misleading because there are really two subgroups with their own typicalities.
The class shown in histogram C does not have subgroups. This histogram has one big clump. For this classs we sensibly could calculate the mean of this group of numbers. Doing so is appropriate and helpful. The class has meaningful typicality.
The class shown in histogram D does has niether one big clump nor multiple subgroups. In this class the student scores look almost random. For this classs we hesitantly could calculate the mean of this group of numbers. Doing so is in theory appropriate because the students are in a single, meaningful group. But it is probably not be helpful. The class lacks typicality because no score is most common or most representative of the random mess. Yes, its single group has an average, but so what? For what purpose are we trying to condense this mess of test scores into a single summary number?
There is a name for how those four histograms difffer in obvious and important ways.
The name comes from considering a question. If the mean was representative of a standard value for the group, how much do all the numbers in the group deviate from that standard?
Standard Deviation
The measure of how poorly a group of numbers forms a single, meaningful clump is called standard deviation.
The formula for calculating standard deviation is not a part of this math class. But without a formula you can visually sort the four histograms.
Histogram C has the smallest standard deviation because in that group the numbers huddle in one big clump. They deviate only a little bit from the mean.
Histogram D has slightly bigger standard deviation because in that group the numbers look random. They are neither pulled toward nor pushed away from the mean.
Histogram A has a big standard deviation because in that group the numbers look pushed away from the mean. They are forming a pattern away from a single standard value.
Histogram B has the biggest standard deviation because in that group the numbers look almost allergic to the mean. They are hiddling against the far edges, as if avoiding being anywhere near a single standard value.
To repeat, the concept of standard deviation is important. Not all groups of numbers have a meaningful representative average. It is useful to be able to talk about this, to know there is a measure for this, and to realize you can visually sort using this.
If you ever actually wanted to know the value of the standard deviation for a group of numbers, you could always use an online tool.
The four standard deviations are:
- Group A: 27
- Group B: 37
- Group C: 11
- Group D: 26
Yes, or visual sorting was correct. Also notice how much lower the value for group C is than the others! It is the only group of test scores for which the average value is clearly meaningful.
All four of this histograms were mostly symmetric. What happens if our group of numbers has some atypically low or high values that make its histogram unsymmetric?

Let's return to that preschool classroom in which the students' weights are 34, 36, 36, 36, 37, 37, 38, 39, 39, 40, 40, and 41 pounds.
Now three of the preschoolers insist their favorite stuffed animals, with weights 1, 1, and 2 pounds, also be included.
Those new weights atypically low. They make the histogram unsymmetric!
First we add up all the numbers.
34 + 36 + 36 + 36 + 37 + 37 + 38 + 39 + 40 + 40 + 41 + 1 + 1 + 2 = 457 pounds
Then we divide that total by 15, because there are 15 "friends".
457 pounds ÷ 15 ≈ 30 pounds
We calculated that answer correctly. But the answer feels very wrong. The number 30 does not describe what is most common, and is not representative of anything in the room.
It feels wrong that the stuffed animals have such a big influence. What can we do better?
We need a different kind of average. What if, instead of doing any calculation, we simply picked the middle number of a sorted list?
The Median
To find the median of a group of numbers, first sort the list of numbers in order and then pick the middle number in that sorted list.
If the list has an even number of values then there will be no middle value. Instead we find the mean of the two values most in the middle.
First we sort the list.: 1, 1, 2, 34, 36, 36, 36, 37, 37, 38, 39, 40, 40, 41
The two middle values are 36 and 37. Their mean is (36 + 37) ÷ 2 = 36.5 pounds
This answer feels right. There are indeed preschoolers who weigh around 36.5 pounds. The number 36.5 does an okay job showing what is most common, and is representative for that classroom.
That median is less than the mean when we did not include any stuffed animals. But it feels okay that the stuffed animals have a measurable but not dramatic influence.
Notice that process of finding the median throws out any atypical smallest or largest values. This is the type of average for those second category of people who felt most natural defining "typical" by throwing suspiciously extreme or rare amounts.
In other words, the median focuses on most representative numbers of the group. As the previous problem demonstrated, the median can also do a respectable job at estimating the most common.

You can think of the median as ignoring the most extreme values on a histogram and then finding where the rest of them balance. That is not quite how the median works, especially if the group of numbers is small. But in the real life situations where the median is used it will ideally behave that way.
The median is appropriate and often used for company salaries, state incomes, neighborhood house values, and other situations where the lowest and highest values really should not be thought of as representative of the group.
Khan Academy
Just for the sake of completeness, know there is a third kind of average called the mode.
The Mode
The mode of a group of numbers is the number that appears most ofen. If there is a tie, all ties are modes.
(On a histogram, the modes are the tallest bars.)
The only number to appear three times is 36. So the mode is 36 pounds.
The mode is so very rarely used in real life that it is only taught in math classes because of tradition. It will not appear in homework or a test.
The mode can count the "popular vote" in an election. But it focuses too much on most common and as a result does a terrible job of measuring most representative.
Try these ten exercises on scratch paper. Work in a study group if you can! Notice where your notes need improvement. After you are very happy with your answers, you can use this form to ask me to check your work. Can you get at least 8 out of 10 correct?
1. Find the mean of these six numbers: 135, 95, 11, 5, 33, 15.
2. Continuing the previous probem, find the median of those six numbers.
3. The bar chart below (original source) shows the number of books read by different children. What is the mean number of books read?

4. Continuing the previous problem, what is the median number of books read?
5. The home values on a certain street, in thousands of dollars, are: 384, 364, 342, 346, 360, 356, 265, 417, and 530. What is the mean of these home values?
6. Continuing the previous problem, what is the median of those home values? Why does this type of average better communicate the "typical" value of a home on that street?
7. A shipping company needs to transport seven freight containers. Their weights are 10, 16, 16, 18, 20, 60, and 77 tons. What is the mean and median weight of these freight containers?
8. Two company clerks receive a report that only contains the mean and median weights, and number of containers, from the previous problem. The first clerk tries to find the total weight by multiplying the mean by the number of containers. The second clerk tries to find the total weight by multiplying the median by the number of containers. Which clerk is correct? Why? How much error does the other clerk have?
9. Some news articles make a big deal when many countries have an average temperate increase well above global average (Alaska, Canada, Russia, Norway, Finland, Switzerland, China, Singapore, Australia, South Africa, etc.) How does a better understanding of averages explain that having many items above average is neither surprising nor sensationalism?
10. During the 2007 strike of the Writer's Guild of America, two different news reports painted very different pictures of these screen and television writers.
• According to CNBC, there were 4,434 guild writers who worked full-time in 2006, and their average salary was $204,000. (CNBC headline, October 11, 2007)
• According to the Los Angeles Times, the median income of the writers from their guild-covered employment is $5,000 a year. (Howard A. Rodman, October 17, 2007)
Were Hollywood's writers very wealthy and going to strike even though they earned much more than most Americans? Or were they poor and going on strike to defend the few thousand dollars they could earn from their writing? The headlines leave out two important facts. First, almost half of the guild's writers don't write anything in a given year (their salary that year is $0). Second, a very few writers earn millions of dollars. How does a better understanding of averages explain the situation more clearly?
Try these exercises on scratch paper. Work in a study group if you can! Notice where your notes need improvement. Check your work when you are done.
Conquering the Generalization Instinct
The sixth chapter of Factfulness includes many examples of when sorting information into the wrong "bins" causes incorrect conclusions. Hans Rosling describes several ways this happens.
Bins might hide differences. A bar graph showing the average income with a bin for each country has no practical value. Within each country are dramatic differences in income. Those bins attempt to group together people who are actually too different.
Bins might hide similarities. Everywhere in the globe, the main factor that affects how people live is their income level, not their country, culture, or religion. A bar graph showing literacy rates with a bin for each religion is promoting stereotypes. The meaningful comparison is literacy rates with income level. If bins about religion make any trend it would only be a side-effect of how religions and income levels match up.
Bins might measure averages. As we have seen, many groups of numbers have no meaningful average. No single number is "most common" or "most representative". If colllege students tend to equally drink no tea or a lot of tea, then a histogram showing the average number of cups of tea drunk by the students in different classrooms will have valid bins (each classroom) but meaningless heights (no students actually drink what looks like a common medium amount).
Bins might measure majorities. Many situations have no meaningful majorities. Most math students get a majority of questions correct on their math tests. But test scores of 51% and 91% are hugely different!
Bins might measure something meaningless. A high school could publish a histogram of its graduates' SAT scores. But those SAT scores do not reliably predict anything, so the histogram has no meaningful implications.
Bins might make generalizations. A bar graph might show what percentage of people in each country have annual dental cleanings. But different cultures place different emphasis on dental care. That statistic might meaningfully represent one country's overall health care, but say nothing meaningful about another country.
Only special cases might be included in the bins. A histogram showing the test scores of all a high school's math students would look very different from a histogram showing the test scores of the students in the AP math class.
Heritability describes something about a population of people, not an individual. It makes no more sense to talk about the heritability of an individual’s IQ than it does to talk about his birthrate.
- Richard Hernstein
Some histogams form one very symmetric clump. These are called bell curves because they are shaped like a bell. They are sometimes instead called normal curves or a normal distribution.

Bell curves can happen when an average result is the most common, being higher or lower than average is equally likely, and being way higher or lower could happen but is rare.
Repeatedly finding the sum of two dice will create a bell curve.
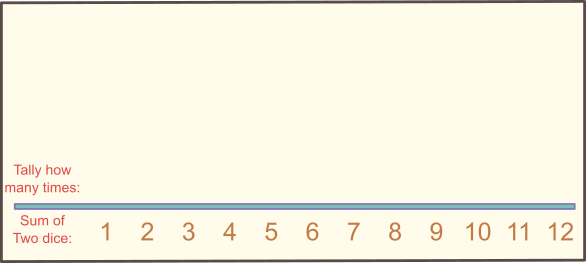
Let's try this as a group activity.
Notice that making a bell curve reliably requires counting a very large number of things. The histogram for each student group might not look at all like one symmetrical clump. But after combining the entire classroom's counts we do get a bell curve.
We saw how a random event can make a bell curve. Where else do bell curves naturally happen?
Heights and weights are two natural physical characteristics of people that will form a bell curve if a large enough group of people are measured.
Not many! Natural characteristics that form bell curves can be difficult to find.
Vision is one. Most people have close to "normal" vision with near-sightedness and far-sightedness forming the sides of the curve.
Bicep strength is another. Perhaps our class should try dumbell curls?
Grip strength is another.
Within a homogenous population, blood pressure and life expectancy can be others.
Consider a pair of mostly similar bell curves counting people.
Because the two bell curves have the same area, they both count the same number of people.
Because the two bell curves have the same middle value, the average is the same for both sets of people.

We already have the vocabulary to describe the difference. The blue curve is more spread out, so it has a higher standard deviation.
In the pink bell curve more people are average or nearly average, and fewer are notably higher or lower. Because of how bell curves work, this effect is exaggerated near the middle and extremes. The pink bell curve has a lot more average people, and a lot fewer extremely high or low people.
In the blue bell curve more people are funky. Most are still average or nearly average. But comparatively more are notably higher or lower. Because of how bell curves work, this effect is exaggerated near the middle and extremes. The blue bell curve has a lot fewer average people, and a lot more extremely high or low people.
Both bell curves have mostly average people. Both curves have the same meaningful average that represents both most common and most typical. Neither curve is a random mess.
Both bell curves have some very high or low people. The "tails" of both bell curves remain above zero as they go on and on. Neither curve has a monopoly on extremes.
Imagine these curves measured height. The pink bell curve is measuring a group of people that strongly tend to be about average height—not too many are much taller or shorter, and the group has very, very few giants and dwarves. The blue bell curve is measuring a group of people with less tendancy to be average height—many more are taller or shorter than average, and although the group still has very few giants and dwarves, if you happened to see a giant or dwarf it would probably be from the blue group.
Remember that few natural demographic characteristics formed bell curves. We had trouble brainstorming any besides height and weight.
Far more common is when people purposefully construct tests designed to sort people into a bell curve, such as IQ Tests or college entrance exams. Because these tests are designed to make the bell curve happen, they can do it very well. But that comes at the cost of sacrificing doing anything else well. IQ Tests are famous for measuring not intelligence but "whatever it is IQ Tests measure". College entrance exams do not reliably predict whether a student is actually ready for college and will successfully earn a college degree.
Be especially wary if you read about socioeconomic characteristics that form a bell curve!
Very, very few places have bell curve distributions of wealth, income, education, etc. Those bell curves are rare!
But the field of sociology (especially in America) has an alarming track record of expecting these to form bell curves. So researchers use increasingly sloppy methods of data collection or analysis until their expectations are finally met.
Remember that histogram bin choices can change the shape of the histogram. There are other ways that sloppy choices (even if made unknowingly and accidentally) can misrepresent data.
Part of math jargon is giving certain words a very precisely defined definition. The words "average", "function", and "parallel" have a meaning in math that resembles their standard use but is more specific. In other math classes you might learn about special math definitions for the words "commute", "set", "group", or "normal".
Sometimes the opposite happens, and phrases that were originally a precise math definition shift to casual English usage and acquire a broader and fuzzier meaning.
In math jargon, "grading on a curve" means something very specific. The test must be of a kind designed to have its scores produce a bell curve (such as the SAT or ACT college entrance exams). There must be enough scores to make sure that bell curve happens (the way it took many coin flips to make that situation have a bell curve).
Only then it would make sense to use the bell curve histogram to assign grades. Most scores are average and get a C. A smaller number of scores are slightly below or above average and get a D or B (and the number of D's and B's is nearly equal). A very few scores are exceptionally low or high and get a F or A.
When designed properly, and refined over time, tests like these are so predictable that grades can be assigned to scores before the test happens! The previous group of scores will have histograms almost identical to the next group of scores. The test designers know where the distinction between each letter grade will happen even before the next test happens.
All of this is what mathematicians mean by "grading on a curve". The test has such a careful design and well-established history that everyone knows in advance where the distinction between each letter grade will happen.

Needless to say, there are very, very few college tests that fit this model. Only large universities have classes with enough students so that there are enough scores to make a nicely full histogram. Even in those big classes, there are only a few tests are designed primarily to create a bell curve of scores.
And remember that tests designed to make a bell curve usually cannot also be designed to measure student readiness for future success—most instructors value the latter and try to write tests accordingly.
So when most college instructors says they "grade on a curve" they are probably not using those words as a mathematician would.
Ask those instructors what they do mean by that phrase!
Often an instructor who says that he or she "grades on a curve" is actually using that phrase as part of an attempt to explain that he or she knows the tests will not reliable and predictably form a bell curve, and that he or she knows better than to actually grade on a curve!
On another note, the following image from a book about mental health attempts to show that a normal amount of stimulus is healthy even though excessive stimulus is too stressful. The graph below is not a histogram, and thus not a bell curve! Why not?

How could we change one word to make the graph a bell curve describing a population's stress level?
How could we change one word to make the graph a bell curve describing a person's stress level in different days of their life?
Try these ten exercises on scratch paper. Work in a study group if you can! Notice where your notes need improvement. After you are very happy with your answers, you can use this form to ask me to check your work. Can you get at least 8 out of 10 correct?
The most interesting part of bell curves is how they are used to sort people and shape society. That is not a great source of small math problems! So please pardon a brief tangent into our local contributions towards climate change.
In Oregon, a household's energy usage per month forms a histogram that resembles a bell curve reasonably well for real-life data.
The histogram below shows the monthly electrical useage for a household that has electric heat.

1. In which month does this household use the most electricity?
2. Which month has the least deviation from year to year?
3. Someone asks, "What is this household's typical monthly electrical usage?" What would make a numeric answer to this question meaningful?
4. When did this family replace their old electric furnace with a modern and more efficient heat pump?
5. The total electrical usage for 2017 was 14,780 kilowatt hours. The total electrical usage for 2019 was 11,513 kilowatt hours. How much less electricity was used in 2019?
6. Electricity costs an average of 11.3 cents per kilowatt hour. How much less money was spent on electricity in 2019 than in 2017?
7. What was the percentage decrease of this household's total annual electricity usage when comparing 2017 to 2019?
8. In this city 80% percent of the electric power is from carbon-free hydroelectric energy, making an overall CO2 emission of 16.2 grams per kilowatt hour. How many kilograms of CO2 did this household's electric use create in 2019?
9. A typical gasoline automobile's emission is 8.8 kilograms of CO2 per gallon. This household's car gets 30 miles per gallon. How many miles would they need to drive to the equal CO2 emissions of their annual electricity use?
10. That household actually drives 10,000 miles per year, which is equivalent to about 333 gallons of gasoline. Find this household's total kg of CO2 emissions for house and car, and then divide by 1,000 to convert kilograms to metric tons. Purchasing a carbon offset costs about $14 per metric ton of CO2. What is the value of the carbon offset cost for this household's house and car?
For most households the energy used to grow and transport food is a larger carbon footprint than home heating or vehicle driving. You can use a website such as CarbonFootprint to estimate your own numbers.
The Central Lane Metropolitan Planning Organization has found that in the Eugene-Springfield area the mean household carbon footprint is 31.9 metric tons of CO2, and the mean carbon footprint per person is 13.8 metric tons of CO2.
(no random exercises for this topic)
The ninth chapter of Factfulness talks about blames versus causes. Hans Rosling writes:
The blame instinct makes us exaggerate the importance of individuals or of particular groups. This instinct to find a guilty party derails our ability to develop a true, fact-based understanding of the world: it steals our focus as we obsess about someone to blame, then blocks our learning because once we have decided who to punch in the face we stop looking for explanations elsewhere.
The same instinct is triggered when things go well. "Claim" comes just as easily as "blame". When something goes well, we are very quick to give credit to an individual or simple cause, when again it is usually more complicated.
...It's almost always about multiple interacting causes—a system. If you really want to change the world, you have to understand how it actually works and forget about punching anyone in the face.
Statistics can be used to place blame. For example, Coleman Hughes explains the gap-lens and past-lens with fascinating examples.
Bell curves especially are misused by people to try to create villains or heroes. Bell curves had distract us from looking at root causes and systems.
"Did you know that adult chronic criminals, as a group, tend to have unusually low IQs? That must mean that IQ predicts something about misbehavior!" Actually there is no connection between IQ and villains. Instead there is a systemic cause. Men born with chromosonal disorders have a higher than normal chance of developing both behavior problems and lower IQs. Many of these men become adult chronic criminals. The actual issue is whether society can develop a system for dealing with chromosonal disorders, not how it blames low-IQ individuals.
Let's make our frequency table about the 21 pet choices even better.
We could use percentage = part ÷ whole we can find what percentage of total students picked each pet.
For example, 6 cat ÷ 21 total ≈ 29% of the students picked "cat".
The most helpful frequency tables have this information a third column. To be extra clear, we call the numbers we actually counted the counted frequency and the percentages the relative frequency.
| Animal | Counted Frequency | Relative Frequency |
|---|---|---|
| cat | 6 | 29% |
| fish | 3 | 14% |
| bird | 5 | 24% |
| horse | 2 | 9% |
| dog | 4 | 19% |
| unicorn | 1 | 5% |
The relative frequences would look like the counted frequences with a percent symbol attached.
Let's spend some time with a different set of data.
This table shows the data generated in a past term from Gretchen Rubin's online Four Tendencies Quiz.

| Response | Frequency (raw count) | Relative Frequency (as fractions) | Relative Frequency (as decimals) | Relative Frequency (as percentages) |
|---|---|---|---|---|
| Questioner | 5 | 5⁄22 | ||
| Rebel | 4 | 0.18 | 18% | |
| Obliger | 11 | |||
| Upholder | 2 | |||
| Total | 22 |
The fractions are 5⁄22, 4⁄22, 11⁄22, 2⁄22, and 22⁄22.
The decimals (rounding to the nearest hundredths if appropriate) are 0.23, 0.18, 0.5, 0.09, and 1
The percentages (rounding to the nearest percent) are 23%, 18%, 50%, 9%, and 100%
Your response is personal. For me, it was surprising to see so many people in that class pick "Obliger".
Notice that when making a bar chart we can label the vertical axis with either the counted frequency or the relative frequency.
Let's do both!

They look the same except for how the vertical axis is labeled.

Applications of relative frequency are usually percent of... style problems. We solve them when we multiply the relative frequency by some other number.
Let's do three examples using our pet data. Here is that relative frequency table again.
| Animal | Counted Frequency | Relative Frequency |
|---|---|---|
| cat | 6 | 29% |
| fish | 3 | 14% |
| bird | 5 | 24% |
| horse | 2 | 9% |
| dog | 4 | 19% |
| unicorn | 1 | 5% |
We see that 29% of the votes were for "cat".
So we ask, "What is 29% of 80?"
Then 80 × 0.29 ≈ 23 days with cat facts during that term
We see that 29% of the votes were for "cat".
So we ask, "What is 29% of 35?"
Then 0.29 × 35 ≈ 10 photos of cats on the wall
We see that 19% of the votes were for "dog".
So we ask, "What is 19% of 252?"
Then 0.19 × 252 ≈ 48 dog cookies
We can view relative frequencies as scale factors. We scaled the total days of the term, and the total pictures on the wall.
Relative frequencies have a lot more practical application than counted frequencies. No one cares that the classroom happened to have 21 students in attendance on the day the teacher asked about favorite pets. The number 21 is unimportant. What might be important is scaling the relative frequencies to fit a different situation.
The trickiest kind of frequency tables measure how two different effects overlap.
That kind of overlap is called contingency. So these are named contingency tables.
They are easiest to understand with an example.
A survey of seventy LCC students asked about exercise and whether they homeschooled kids in 2020.
| How Much are you Exercising? | Homeschooling | Not Homeschooling | Total |
|---|---|---|---|
| Not at all | 16 | 10 | 26 |
| A little, but not enough | 10 | 18 | 28 |
| Yes, enough | 2 | 14 | 16 |
| Total | 28 | 42 | 70 |
Notice that contingency tables will not normally have a relative frequency column or row. That looks too crowded. But we can still find that type of information.
percentage = part ÷ whole = 28 ÷ 70 = 0.4 = 40%
The tricky part of using contingency tables is that so many different kinds of questions can be asked. This means that when finding relative frequency with percentage = part ÷ whole we need to be really careful about what is "part" and what is "whole"
The whole amount is quite often implicitly the grand total.
percentage = part ÷ whole = 2 ÷ 70 ≈ 0.029 ≈ 3%
The whole amount can also be smaller than the grand total.
percentage = part ÷ whole = 2 ÷ 28 ≈ 0.07 ≈ 7%
Stay alert!
Next we will make this data into a pie chart.
| Response | Relative Frequency (as decimals) | Degrees for Pie Chart |
|---|---|---|
| Questioner | ||
| Rebel | 0.18 | 0.18 × 360° = 65° |
| Obliger | ||
| Upholder | ||
| Total |
The decimals are the same as before. If we round to the nearest hundredths when appropriate they are 0.23, 0.18, 0.5, 0.09, and 1
The degree amounts are 83°, 65°, 180°, 32°, and 360°
Now we can make a pie chart. We could use a protractor. Or we can estimate the angles using the fact that a relative frequency of 25% would become a 90 degree angle, a relative frequency of 50% would become a 180 degree angle, etc.

Bar charts are good for comparing frequencies. Pie charts are usually less clear.
But pie charts can be very dramatic. For example, here is a famous pie chart of how five big tech companies dominated the S&P 500 in the year 2018.

Pie charts can also help compare just a few things: especiall when those few things change over time. For example, these charts compare the popular votes and Electoral College votes of presidential elections between 1860 and 2012.

The second chapter of Factfulness discusses ways to avoid negativity. Hans Rosling advises us that good situations, especially gradual improvements, are seldom reported. So most news is bad news—and when we hear bad news we should ask both "What good situation was not reported?" and "Is this bad situation, although bad, getting better?"
When studying math two attitudes (not from the book) counteract negativity.
The first attitude is confidence. This word has a special meaning in the setting of personal growth, including any college class.
If we knew a situation would have success, we would have certainty. If we were less sure but had a lot of hope for success, we would have optimism.
If we instead embraced the uncertainty, recognized that life is more complex than success or failure, and acted with the expectation that the situation will be worthwhile for teaching us something about life or ourselves—that is confidence.
Be confident! One lesson of weighted average math problems is that worthwhile situations have many possibilities, and we can consider them all without focusing on success or failure.
In the words of Mark Manson:
Happiness comes from solving problems. The keyword here is "solving." If you're avoiding your problems or feel like you don't have any problems, then you're going to make yourself miserable. If you feel like you have problems that you can't solve, you will likewise make yourself miserable. The secret sauce is in the solving of the problems, not in not having problems in the first place.
When the standard of success becomes merely acting—when any result is regarded and progress and important, when inspiration is seen as a reward rather than a prerequisite—we propel ourselves ahead.
Because here's something that's weird but true: we don't actually know what a positive or negative experience is. Some of the most difficult and stressful moments of our lives also end up being the most formative and motivating. Some of the best and most gratifying experiences of our lives are also the most distracting and demotivating. Don't trust your conception of positive/negative experiences. All that we know for certain is what hurts in the moment and what doesn't. And that's not worth much.
The second attitude is holistic philosophy.
Our earliest understanding of self is based on self-observation and information from authority figures. A girl's parents tell her "You love to dance!" when she was three years old. She had not really bothered to think about it, but they were right.
Cartesian philosophy breaks wholes into parts for understanding. This can allow a different understanding. Dancing involves moving lots of bones and muscles. They joy a dancer feels is part of endorphins and other aspects of brain chemistry.
(But it would be dreadful to assume the Cartesian thought must somehow oppose or debunk the earlier type of thought. No one would say, "Little girl, your dancing is just bones and muscles moving. Your joy is just brain chemistry.")
Systems Theory philosophy views parts in networks. Once the girl who loves dance is a little older she starts to understand how she is part of a family, and a school, and a community, and a dance class, etc.—and what those connections offer her and what she offers to others.
Quantum Mechanical philosophy teaches us to see things as clouds of possibilities. That girl as a young teen wants to grow up to be a dance teacher. She might! But maybe she will also become a writer. That would also be nice. And so on. All those possibilities are a part of her. But not everything is a possibility. She is not going to grow up to be an umbrella, or a shepherd in Alaska.
Modern philosophy notices that Systems Theory philosophy always looks from the outside at a network. If we asked the young woman who loves dancing what she herself thinks about her network, what would she say? What does her network think of her? Then words like "justice", "inspiration" and "integrity" appear that do not have a place in Systems Theory.
All these philosophies can exist together in a holistic and complimentary way. For not only does our fictional young woman see herself in all these ways, but she wants others to see her in all those ways too. She has a certain height and appearance. Her years of ballet have done some harm to her ankles and toes, which affects her today. She is a mother, teacher, and friend. She still has dreams and possibilities. She helps inspire people to better understand themselves and their community.
It is often a challenge to see other people holistically. But doing so—considering their appearance, parts, networks, possibilities, and internal thoughts and points of view—is a key part of treating other people as we treat ourselves.
Be holistic! One lesson of weighted average math problems is that people are a mix many possibilities, and it helps to consider a person as a cloud of possible future versions of themselves.
Watch this video of Ryan Hayashi's coin magic. He is uncertain! He is nervous! His hands shake like crazy! But he is utterly convinced that the situation is worthwhile and meaningful, and has moved beyond thinking about success or failure. And in response, for the first and only time, Penn and Teller tell a magician that they got so drawn into his act, and wrapped up in his confident energy, that they actually forgot to keep analyzing his routine.
Watch Mindwalk for a relxing overview of the evolution of philosophy. Note that the film is from 1990 and thus stops with Systems Theory philosophy.


